Chinese Medical Sciences Journal ›› 2020, Vol. 35 ›› Issue (1): 71-84.doi: 10.24920/003535
• Original Article • Previous Articles Next Articles
Methylenetrahydrofolate Reductase Gene C677T Polymorphism and Diabetic Retinopathy: a Meta-Analysis
Shen Chang, Zhao Meng, Li Yunyun, Liu Ningpu( )
)
- Beijing Tongren Eye Center & Beijing Ophthalmology and Visual Sciences Key Laboratory, Beijing Tongren Hospital, Capital Medical University, Beijing 100730, China
-
Received:2019-06-02Published:2020-03-31Online:2020-04-16 -
Contact:Liu Ningpu E-mail:nliu001@yeah.net
Cite this article
Shen Chang, Zhao Meng, Li Yunyun, Liu Ningpu. Methylenetrahydrofolate Reductase Gene C677T Polymorphism and Diabetic Retinopathy: a Meta-Analysis[J].Chinese Medical Sciences Journal, 2020, 35(1): 71-84.
share this article
Add to citation manager EndNote|Reference Manager|ProCite|BibTeX|RefWorks
Table 1
Methodological quality assessment scale"
| Criteria | Score |
|---|---|
| Representativeness of cases | |
| DR diagnosed according to ETDRS | 2 |
| DR diagnosed according to other DR criteria | 1.5 |
| DR diagnosed according to doctors’ assessments | 1 |
| Not mentioned | 0 |
| Source of controls | |
| Population or community based | 3 |
| Hospital-based DM-free controls | 2 |
| DR-free DM patients without other complications | 1 |
| DR-free DM patients with other complications | 0.5 |
| Not described | 1 |
| Sample size (n) | |
| >200 | 2 |
| 100-200 | 1 |
| <100 | 0 |
| Quality control of genotyping methods | |
| Repetition of partial/total tested samples with a different method | 2 |
| Repetition of partial/total tested samples with the same method | 1 |
| Not described | 0 |
| Hardy-Weinberg equilibrium | |
| Hardy-Weinberg equilibrium in control subjects | 1 |
| Hardy-Weinberg disequilibrium in control subjects | 0 |
| Quality scores | 10 |
Table 1

Figure 1.
Flow chart of the literature search. #: Our own data unpublished."
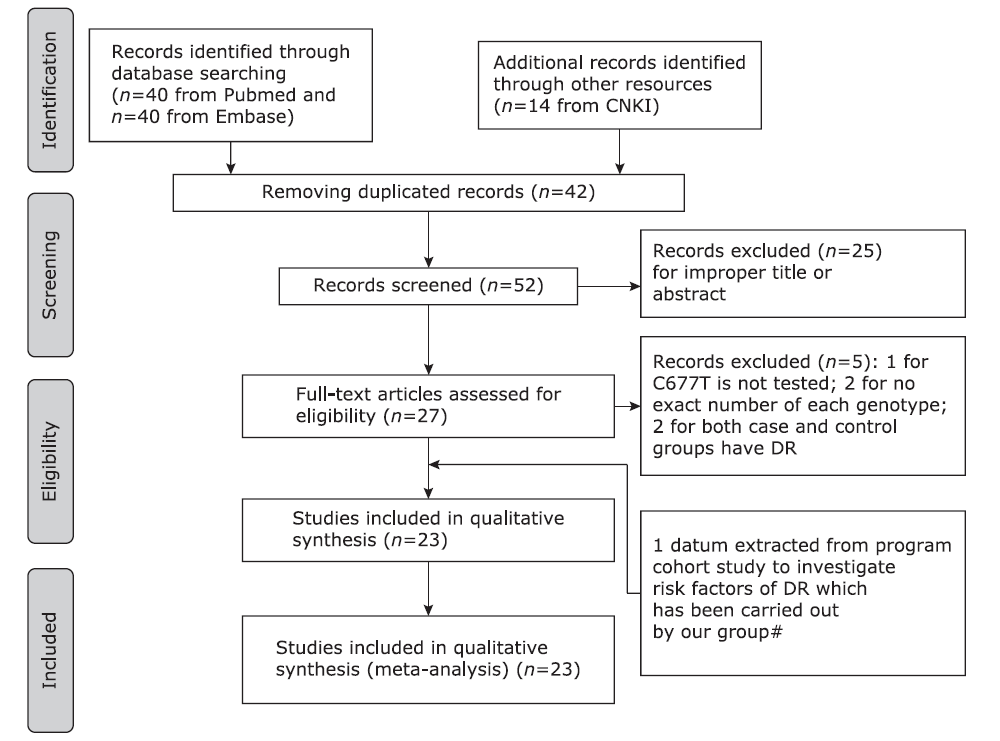
Figure 1.
Table S1.
Clinical and biochemical markers for the studied groups§"
| Clinical characteristics | Ncd group (n=212) | DR group (n=262) | P value |
|---|---|---|---|
| Age of diabetic onset (yrs) | 53.12±7.68 | 50.75±9.09 | 0.001 |
| Sex (Male/Female, n) | 85/127 | 121/141 | 0.184 |
| Duration of diabetes (yrs) | 14.67±4.73 | 13.96±7.25 | 0.203 |
| BMI (kg/m2) | 25.18±3.97 | 25.58±3.94 | 0.275 |
| WHR | 0.92±0.06 | 0.93±0.06 | 0.295 |
| High albuminuria (-/+, n) | 181/28 | 188/69 | <0.001 |
| Systolic blood pressure (mm Hg) | 136.96±1.46 | 137.92±17.14 | 0.539 |
| Diastolic blood pressure (mm Hg) | 77.82±9.51 | 78.91±9.43 | 0.211 |
| Insulin therapy (yes/no, n) | 65/147 | 136/125 | <0.001 |
| HbA1c (%) | 6.96±1.32 | 7.62±1.73 | <0.001 |
| FPG (mmol/L) | 8.02±2.31 | 8.89±3.06 | 0.001 |
| Creatinine (µmol/L) | 67.81±17.93 | 73.56±47.56 | 0.096 |
| Uric acid (µmol/L) | 281.72±79.24 | 279.40±76.15 | 0.844 |
| Cholesterol (mmol/L) | 5.07±0.97 | 5.13±1.13 | 0.728 |
| Triglycerides (mmol/L) | 1.58±0.99 | 1.63±1.34 | 0.682 |
| HDLC (mmol/L) | 1.23±0.29 | 1.23±0.30 | 0.988 |
| LDLC (mmol/L) | 3.08±0.83 | 3.07±0.90 | 0.682 |
Table S1.
Table 2
Basic extracted characteristics of the investigated studies"
| References | Year of publication | Race | Case | Control | |||||||||||||
|---|---|---|---|---|---|---|---|---|---|---|---|---|---|---|---|---|---|
| Sample size (n) | Age (yrs) | DM duration (yrs) | Definition of case | DR diagnosis | Sample size (n) | Age (yrs) | DM§ duration (yrs) | Defination of control | DM type | HWE* | MAF* | NOS | Quality assessment | ||||
| Beata et al.[ | 2017 | European | 64 | 62.8±9.7 | 16.97±9.2 | DR with DF | ETDRS | 50 | 65.7±9.7 | 17.1±9.48 | DM | T2DM | 0.64 | 0.73 | 5 | 4.5 | |
| Najiba et al.[ | 2017 | American | 44 | 50.4±12.92 (all) | 8.98±6.9 | DR | NM | 200 | 50.5±12.77 | NA | healthy | T2DM | 0.72 | 0.21 | 5 | 5 | |
| Xing et al.[ | 2016 | Chinese | 76 | NM | NM | DR with/without DN | OC | 56 | no | NA | healthy | T2DM | 0.009 | 0.32 | 6 | 4.5 | |
| Wei et al.[ | 2012 | Chinese | 61 | 59.3±12.7 | 6(median) | DR | OC | 64 | 58.3±14.1 | 4(median) | Ncd | T2DM | 0.254 | 0.258 | 6 | 4.5 | |
| Sun et al.[ | 2014 | Chinese | 176 | 62.38±8.15 | 16.36±6.47 | DR | DA | 241 | 62.95±8.71 | 12.82±6.1 | DM | T2DM | 0.99 | 0.624 | 6 | 4.5 | |
| Guo et al.[ | 2002 | Chinese | 52 | 54.63±12.04 | 4.5 (3.0-8.0) | DR | OC | 28 | 56.57±10.75 | NA | healthy | T2DM | 0.39 | 0.375 | 5 | 4.5 | |
| Guo et al.[ | 2002 | Chinese | 52 | 54.63±12.04 | 4.5 (3.0-8.0) | DR | OC | 52 | 55.17±6.87 | 15(median) | Ncd | T2DM | 0.43 | 0.45 | 5 | 4.5 | |
| Wang et al.[ | 2001 | Chinese | 62 | 62.5±8.08 | 8.29±6.39 | DR | OC | 117 | 59.42±14.87 | 7.28±5.8 | DM | T2DM | 0.68 | 0.3 | 7 | 4 | |
| Wang et al.[ | 2001 | Chinese | 62 | 62.5±8.08 | 8.29±6.39 | DR | OC | 85 | 41.83±17.1 | NA | healthy | T2DM | 0 | 0.73 | 7 | 3.5 | |
| Yang et al.[ | 2001 | Chinese | 60 | 50.7±12.1 | <5 | DR | DA | 102 | 48±8.2 | >10 | Ncd | T2DM | 0.17 | 0.41 | 6 | 4 | |
| Yang et al.[ | 2001 | Chinese | 60 | 50.7±12.1 | <5 | DR | DA | 62 | 52.6±14.9 | NA | healthy | T2DM | 0.91 | 0.35 | 6 | 5 | |
| Sun et al.[ | 2003 | Chinese | 110 | 55.6±6.7 | <5 | DR | OC | 98 | 54.7±7.1 | >10 | DM | T2DM | 0 | 0.33 | 7 | 4 | |
| Sun et al.[ | 2003 | Chinese | 110 | 55.6±6.7 | <5 | DR | OC | 57 | 42.3±6.1 | NA | healthy | T2DM | 0 | 0.31 | 7 | 4.5 | |
| Huang et al.[ | 2005 | Chinese | 50 | NM | NM | DR (72% with DN) | OC | 47 | no | NA | healthy | T2DM | 0.96 | 0.25 | 5 | 4.5 | |
| Yi et al.[ | 2005 | Chinese | 245 | 56.53±10.45 | 5.9±4.8 | DR (27% with protein urine) | OC | 65 | no | NA | healthy | T2DM | 0.01 | 0.31 | 4 | 3.5 | |
| Liu et al.[ | 2006 | Chinese | 44 | 51.9±7.5 | NM | DR | DA | 84 | 54.0±13.2 | NA | healthy | T2DM | 0.01 | 0.25 | 6 | 4 | |
| Ren et al.[ | 2011 | Chinese | 219 | 59.95±10.55 | 11(median) | DR | DA | 294 | 58.52±12.26 | 7 (median) | DM | T2DM | 0.23 | 0.41 | 6 | 4.5 | |
| Santos et al.[ | 2003 | American | 99 | 58.7±12(all) | 14.9 (median) | DR | OC | 111 | 58.7±12 (all) | 6.6 (median) | DM | T2DM | 0.98 | 0.39 | 5 | 5 | |
| Errara et al.[ | 2003 | American | 46 | 55.43±15.33 | 18±8.67 | DR(NPDR81, PDR60) | OC | 106 | 66.11±7.06 | NA | healthy | T1DM | 0.24 | 0.39 | 4 | 5.5 | |
| Errara et al.[ | 2003 | American | 95 | 55.43±15.33 | 18±8.67 | DR(NPDR81, PDR60) | OC | 106 | 66.11±7.06 | NA | healthy | T2DM | 0.24 | 0.39 | 4 | 6.5 | |
| Maeda et al.[ | 2008 | Japanese | 75 | NM | NM | DR | OC | 115 | NM | NM | DM | T2DM | 0.06 | 0.35 | 5 | 4 | |
| Yigit et al.[ | 2013 | West Asian | 230 | 57.15±10.58 | 7.73±6.006 | DPN(81DR+DN, 129DN) | ETDRS | 282 | 55.55±8.14 | NA | healthy | T1DM+T2DM | 0.46 | 0.19 | 6 | 6 | |
| Yosioka et al.[ | 2003 | Japanese | 98 | 60 (median) | 11.7 (median) | DR(52NPDR, 46PDR) | NM | 268 | 60 | 11.7 | Ncd | T2DM | 0.46 | 0.38 | 4 | 4 | |
| Maeda et al.[ | 2003 | Japanese | 51 | NM | NM | DR(33NPDR) | OC | 105 | NM | NM | Ncd | T2DM | 0.06 | 0.37 | 4 | 4 | |
| Neugebauer et al.[ | 1998 | Japanese | 67 | 57-61 | 14-16 | DR with DN | NM | 146 | 39-43 | NA | healthy | T2DM | 0.003 | 0.26 | 6 | 4 | |
| Lauszus et al.[ | 2001 | European | 112 | NM | NM | DR(T1DM pregnant) | OC | 1084 | NA | NA | healthy | T2DM | 0.53 | 0.29 | 4 | 6 | |
| Ukinc et al.[ | 2009 | West Asian | 25 | 52.7±9.9 (all) | 7.6±6.2 (all) | DR | OC | 27 | 52.7±9.9 (all) | 7.6±6.2 (all) | DM | T1DM | 0.09 | 0.24 | 4 | 2.5 | |
| Liu et al.# | 2017 | Chinese | 262 | 66.69±8.28 | 14.40±6.51 | DR(18.1% with microalbuminuria) | ETDRS | 212 | 65.37±7.46 | 14.32±6.11 | DM | T2DM | 0.34 | 0.57 | 8 | 8 | |
Table 2
Table 3
The allele/genotype prevalences of MTHFR C677T polymorphism of the investigated studies (number of cases)"
| References | Year of publication | CC | CT | TT | C | T | |||||||||
|---|---|---|---|---|---|---|---|---|---|---|---|---|---|---|---|
| Case | Control | Case | Control | Case | Control | Case | Control | Case | Control | ||||||
| Beata et al.[ | 2017 | 6 | 3 | 30 | 21 | 28 | 26 | 42 | 27 | 86 | 73 | ||||
| Najiba et al.[ | 2017 | 8 | 124 | 36 | 68 | 0 | 8 | 52 | 316 | 36 | 84 | ||||
| Xing et al.[ | 2016 | 17 | 30 | 40 | 16 | 19 | 10 | 74 | 76 | 78 | 36 | ||||
| Wei et al.[ | 2012 | 33 | 37 | 25 | 21 | 3 | 6 | 91 | 95 | 31 | 33 | ||||
| Sun et al.[ | 2014 | 28 | 34 | 88 | 113 | 60 | 94 | 144 | 181 | 208 | 301 | ||||
| Guo et al.[ | 2002 | 5 | 12 | 23 | 11 | 24 | 5 | 33 | 35 | 71 | 21 | ||||
| Guo et al.[ | 2002 | 5 | 17 | 23 | 23 | 24 | 12 | 33 | 57 | 71 | 47 | ||||
| Wang et al.[ | 2001 | 8 | 57 | 27 | 48 | 27 | 12 | 43 | 162 | 81 | 72 | ||||
| Wang et al.[ | 2001 | 8 | 38 | 27 | 10 | 27 | 112 | 43 | 86 | 81 | 234 | ||||
| Yang et al.[ | 2001 | 8 | 32 | 33 | 56 | 19 | 14 | 49 | 120 | 71 | 84 | ||||
| Yang et al.[ | 2001 | 8 | 26 | 33 | 28 | 19 | 8 | 49 | 80 | 71 | 44 | ||||
| Sun et al.[ | 2003 | 33 | 51 | 46 | 29 | 31 | 18 | 112 | 131 | 108 | 65 | ||||
| Sun et al.[ | 2003 | 33 | 31 | 46 | 16 | 31 | 10 | 112 | 78 | 108 | 36 | ||||
| Huang et al.[ | 2005 | 17 | 26 | 25 | 18 | 8 | 3 | 59 | 41 | 70 | 24 | ||||
| Yi et al.[ | 2005 | 68 | 35 | 110 | 19 | 71 | 11 | 246 | 89 | 252 | 41 | ||||
| Liu et al.[ | 2006 | 18 | 47 | 16 | 25 | 10 | 12 | 52 | 119 | 36 | 49 | ||||
| Ren et al.[ | 2011 | 26 | 77 | 78 | 95 | 57 | 41 | 130 | 249 | 192 | 177 | ||||
| Santos et al.[ | 2003 | 34 | 41 | 53 | 53 | 12 | 17 | 121 | 135 | 77 | 87 | ||||
| Errara et al.[ | 2003 | 17 | 36 | 25 | 57 | 4 | 14 | 59 | 129 | 33 | 85 | ||||
| Errara et al.[ | 2003 | 44 | 36 | 41 | 57 | 10 | 14 | 129 | 129 | 61 | 85 | ||||
| Maeda et al.[ | 2008 | 31 | 43 | 28 | 62 | 16 | 10 | 90 | 148 | 60 | 82 | ||||
| Yigit et al.[ | 2013 | 38 | 180 | 30 | 93 | 13 | 9 | 106 | 453 | 56 | 111 | ||||
| Yosioka et al.[ | 2003 | 33 | 100 | 50 | 132 | 15 | 36 | 116 | 332 | 80 | 204 | ||||
| Maeda et al.[ | 2003 | 18 | 37 | 20 | 58 | 13 | 10 | 56 | 132 | 46 | 78 | ||||
| Neugebauer et al.[ | 1998 | 24 | 86 | 31 | 43 | 12 | 17 | 79 | 215 | 55 | 77 | ||||
| Lauszus et al.[ | 2001 | 47 | 542 | 57 | 455 | 8 | 87 | 151 | 1539 | 73 | 629 | ||||
| Ukinc et al.[ | 2009 | 14 | 14 | 11 | 13 | 0 | 0 | 39 | 41 | 11 | 13 | ||||
| Liu et al.# | 2017 | 59 | 42 | 118 | 97 | 85 | 73 | 236 | 183 | 288 | 243 | ||||
Table 3
Table 4
Main results of the association between MTHFR C677T polymorphism and DR"
| Groups | Genetic models | No. of studies (All/Sensitivity) | OR (95%CI) | P | I2(%) | ORse(95%CI) | Pse | I2se(%) |
|---|---|---|---|---|---|---|---|---|
| Overall | Allele (T vs. C) | 28/21 | 1.52 (1.27-1.83) | 0 | 80.2 | 1.46 (1.18-1.82) | 0 | 81.8 |
| Heterozygous (CT vs. CC) | 28/21 | 1.81 (1.40-2.35) | 0 | 73.5 | 1.49 (1.12-1.97) | 0 | 70.1 | |
| Homozygous (TT vs. CC) | 27/20 | 2.27 (1.62-3.18) | 0 | 72.3 | 2.21 (1.41-3.48) | 0 | 78.2 | |
| Dominant model (TT+CT vs. CC) | 28/21 | 1.86 (1.45-2.39) | 0 | 75.0 | 1.65 (1.22-2.24) | 0 | 77.2 | |
| Recessive model (TT vs. CT+CC) | 27/20 | 1.55 (1.16-2.07) | 0 | 73.7 | 1.65 (1.17-2.32) | 0 | 74.5 | |
| Healthy control | Allele (T vs. C) | 14/11 | 1.68 (1.29-2.18) | 0 | 78.4 | 1.84 (1.38-2.46) | 0 | 73.9 |
| Heterozygous (CT vs. CC) | 14/11 | 2.46 (1.64-3.69) | 0 | 77.3 | 2.27 (1.42-3.63) | 0 | 75.8 | |
| Homozygous (TT vs. CC) | 14/11 | 2.55 (1.70-3.83) | 0.008 | 54.4 | 3.02 (1.90-4.80) | 0.036 | 48.3 | |
| Dominant model (TT+CT vs. CC) | 14/11 | 2.31 (1.62-3.29) | 0 | 74.7 | 2.43 (1.53-3.84) | 0 | 78.0 | |
| Recessive model (TT vs. CT+CC) | 14/11 | 1.49 (0.94-2.37) | 0 | 72.3 | 1.87 (1.23-2.83) | 0.042 | 47.1 | |
| Ncd control | Allele (T vs. C) | 5/3 | 1.50 (1.07-2.11) | 0.032 | 62.1 | 1.76 (1.03-3.03) | 0.041 | 68.7 |
| Heterozygous (CT vs. CC) | 5/3 | 1.38 (0.87-2.18) | 0.131 | 43.7 | 1.95 (1.16-3.28) | 0.356 | 3.1 | |
| Homozygous (TT vs. CC) | 5/3 | 2.39 (1.06-5.38) | 0.017 | 66.7 | 2.47 (1.05-5.84) | 0.069 | 62.6 | |
| Dominant model (TT+CT vs. CC) | 5/3 | 1.59 (0.97-2.62) | 0.056 | 56.5 | 2.33 (1.03-5.28) | 0.071 | 62.2 | |
| Recessive model (TT vs. CT+CC) | 5/3 | 1.92 (1.07-3.43) | 0.064 | 55.0 | 1.93 (0.79-4.69) | 0.042 | 47.1 | |
| DM control | Allele (T vs. C) | 9/7 | 1.32 (0.93-1.88) | 0 | 86.6 | 1.17 (0.83-1.66) | 0 | 84.1 |
| Heterozygous (CT vs. CC) | 9/7 | 1.31 (0.87-1.97) | 0.001 | 68.7 | 1.20 (0.79-1.82) | 0.005 | 67.2 | |
| Homozygous (TT vs. CC) | 9/7 | 1.83 (0.91-3.69) | 0 | 85.6 | 1.39 (0.77-2.52) | 0 | 78.0 | |
| Dominant model (TT+CT vs. CC) | 9/7 | 1.42 (0.89-2.28) | 0 | 79.4 | 1.25 (0.80-1.96) | 0 | 75.3 | |
| Recessive model (TT vs. CT+CC) | 9/7 | 1.49 (0.91-2.44) | 0 | 82.3 | 1.22 (0.82-1.83) | 0.002 | 71.6 |
Table 4
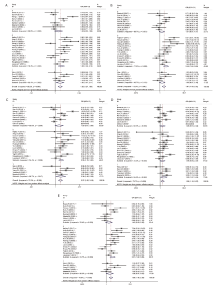
Figure 2.
Subgroup analysis of associations between MTHFR C677T polymorphism and DR by dividing the studied based on the control group categories (0 in these pictures represents the studies having healthy control group, 1 represents the studies having Ncd control group, 2 represents the studies having DM control group. A for allele contrast, B for CT vs. CC, C for TT vs. CC, D for TT+CT vs. CC, E for TT vs. CT+CC. #: Our own data unpublished."

Figure 2.
Table 5
Associations of MTHFR C677T polymorphism and DR in the enrolled studies stratified by ethnicity and DM type"
| Groups | Genetic models | No. of studies (All/Sensitivity) | OR(95%CI) | P | I2(%) | ORse(95%CI) | Pse | I2se(%) | |
|---|---|---|---|---|---|---|---|---|---|
| Healthy control | Asian | Allele (T vs. C) | 9/7 | 1.93 (1.43-2.61) | 0.001 | 69.2 | 2.18 (1.79-2.65) | 0.701 | 0 |
| Heterozygous (CT vs. CC) | 9/7 | 3.22 (2.30-4.51) | 0.163 | 31.9 | 2.80 (2.05-3.83) | 0.630 | 0 | ||
| Homozygous (TT vs. CC) | 9/7 | 3.09 (2.08-4.60) | 0.170 | 31.1 | 3.55 (2.38-5.29) | 0.405 | 2.7 | ||
| Dominant model (TT+CT vs. CC) | 9/7 | 2.90 (2.27-3.70) | 0.598 | 0 | 2.96 (2.22-3.94) | 0.448 | 0 | ||
| Recessive model (TT vs. CT+CC) | 9/7 | 1.68 (0.96-2.95) | 0 | 74.1 | 2.08 (1.47-2.96) | 0.782 | 0 | ||
| Non-Asian | Allele (T vs. C) | 5/4 | 1.32 (0.83-2.09) | 0 | 84.4 | 1.36 (0.72-2.58) | 0 | 88.0 | |
| Heterozygous (CT vs. CC) | 5/4 | 1.53 (0.77-3.06) | 0 | 85.4 | 1.58 (0.58-4.29) | 0 | 89.0 | ||
| Homozygous (TT vs. CC) | 5/4 | 1.60 (0.67-3.83) | 0.015 | 67.8 | 1.80 (0.56-5.83) | 0.014 | 71.9 | ||
| Dominant model (TT+CT vs. CC) | 5/4 | 1.54 (0.78-3.04) | 0 | 85.9 | 1.61 (0.61-4.29) | 0 | 89.5 | ||
| Recessive model (TT vs. CT+CC) | 5/4 | 1.13 (0.43-2.91) | 0.003 | 74.9 | 1.16 (0.31-4.34) | 0.002 | 79.7 | ||
| DM control | Asian | Allele (T vs. C) | 7/5 | 1.49 (0.98-2.26) | 0 | 88.9 | 1.30 (0.89-1.90) | 0 | 85.7 |
| Heterozygous (CT vs. CC) | 7/5 | 1.38 (0.84-2.28) | 0 | 75.9 | 1.25 (0.73-2.14) | 0.001 | 77.5 | ||
| Homozygous (TT vs. CC) | 7/5 | 2.39 (1.05-5.45) | 0 | 88.5 | 1.70 (0.84-3.44) | 0 | 83.4 | ||
| Dominant model (TT+CT vs. CC) | 7/5 | 1.58 (0.90-2.78) | 0 | 83.7 | 1.36 (0.77-2.39) | 0 | 82.5 | ||
| Recessive model (TT vs. CT+CC) | 7/5 | 1.85 (1.03-3.31) | 0 | 85.6 | 1.44 (0.88-2.35) | 0.001 | 77.8 | ||
| Non-Asian | Allele (T vs. C) | 2/2 | 0.91 (0.66-1.26) | 0.455 | 0 | ? | ? | ? | |
| Heterozygous (CT vs. CC) | 2/2 | 1.12 (0.65-1.95) | 0.523 | 0 | ? | ? | ? | ||
| Homozygous (TT vs. CC) | 2/2 | 0.76 (0.36-1.60) | 0.602 | 0 | ? | ? | ? | ||
| Dominant model (TT+CT vs. CC) | 2/2 | 1.03 (0.61-1.75) | 0.45 | 0 | ? | ? | ? | ||
| Recessive model (TT vs. CT+CC) | 2/2 | 0.74 (0.43-1.37) | 0.913 | 0 | ? | ? | ? | ||
| DM control | T2DM | Allele (T vs. C) | 8/7 | 1.37 (0.94-1.98) | 0 | 88.1 | 1.18 (0.87-1.60) | 0 | 80.9 |
| Heterozygous (CT vs. CC) | 8/7 | 1.36 (0.88-2.11) | 0.001 | 72.0 | 1.20 (0.79-1.82) | 0.005 | 67.2 | ||
| Homozygous (TT vs. CC) | 8/7 | 1.83 (0.91-3.69) | 0 | 85.6 | 1.39 (0.77-2.52) | 0 | 78.0 | ||
| Dominant model (TT+CT vs. CC) | 8/7 | 1.49 (0.90-2.47) | 0 | 81.6 | 1.25 (0.80-1.96) | 0 | 75.3 | ||
| Recessive model (TT vs. CT+CC) | 8/7 | 1.49 (0.91-2.44) | 0 | 82.3 | 1.22 (0.82-1.83) | 0.002 | 71.6 | ||
| Healthy control | T2DM | Allele (T vs. C) | 11/9 | 1.81 (1.31-2.49) | 0 | 78.8 | 1.97 (1.43-2.71) | 0 | 72.3 |
| Heterozygous (CT vs. CC) | 11/9 | 2.82 (1.78-4.48) | 0 | 78.5 | 2.67 (1.52-4.70) | 0 | 77.3 | ||
| Homozygous (TT vs. CC) | 11/9 | 2.70 (1.78-4.09) | 0.065 | 42.8 | 2.97 (1.83-4.80) | 0.096 | 40.7 | ||
| Dominant model (TT+CT vs. CC) | 11/9 | 2.75 (1.77-4.27) | 0 | 74.6 | 2.82 (1.63-4.89) | 0 | 79.2 | ||
| Recessive model (TT vs. CT+CC) | 11/9 | 1.48 (0.89-1.51) | 0 | 70.3 | 1.78 (1.25-2.52) | 0.323 | 13.3 | ||
Table 5
Table 6
Results of Begg’s test and Egger’s test"
| Genetic models | Begg’s adjusted rank correlation test (P value) | Egger’s regression asymmetry test (P value) |
|---|---|---|
| Allele | 0.221 | 0.089 |
| CT vs. CC | 0.048 | 0.031 |
| TT vs. CC | 0.288 | 0.142 |
| Dominant model | 0.048 | 0.056 |
| Recessive model | 0.327 | 0.177 |
Table 6
| 1. | Duh EJ, Sun JK, Stitt AW . Diabetic retinopathy: current understanding, mechanisms, and treatment strategies. JCI Insight 2017; 2(14):e93751. doi: 10.1172/jci.insight.93751. |
| 2. | Chong YH, Fan Q, Tham YC , et al. Type 2 diabetes genetic variants and risk of diabetic retinopathy. Ophthalmology 2017; 124(3):336-42. doi: 10.1016/j.ophtha.2016.11.016. |
| 3. | Tarr JM, Kaul K, Chopra M , et al. Pathophysiology of diabetic retinopathy. ISRN Ophthalmol 2013; 2013:343560. doi: 10.1155/2013/343560. |
| 4. | Welch GN, Loscalzo J . Homocysteine and atherothrombosis. N Engl J Med 1998; 338(15):1042-50. doi: 10.1056/NEJM199804093381507. |
| 5. | D’Angelo A, Selhub J . Homocysteine and thrombotic disease. Blood 1997; 90(1):1-11. doi: 10.1182/blood.V90.1.1 |
| 6. | Engbersen AM, Franken DG, Boers GH , et al. Thermolabile 5,10-methylenetetrahydrofolate reductase as a cause of mild hyperhomocysteinemia. Am J Human Gene 1995; 56(1):142-50. |
| 7. | Friedman G, Goldschmidt N, Friedlander Y , et al. A common mutation A1298C in human methylenetetrahydrofolate reductase gene: association with plasma total homocysteine and folate concentrations. J Nutr 1999; 129(9):1656-61. doi: 10.1093/jn/129.9.1656. |
| 8. | McCully KS . Homocysteine metabolism, atherosclerosis, and diseases of aging. Compr Physiol 2015; 6(1):471-505. doi: 10.1002/cphy.c150021. |
| 9. | Sen U, Pushpakumar SB, Amin MA , et al. Homocysteine in renovascular complications: hydrogen sulfide is a modulator and plausible anaerobic ATP generator. Nitric Oxide 2014; 41(6):27-37. doi: 10.1016/j.niox.2014.06.006. |
| 10. | Kayadibi H, Sertoglu E, Uyanik M . Plasma total homocysteine levels in diabetic retinopathy. Biomed Res Int 2014; 2014(1):758634. doi: 10.1155/2014/758634. |
| 11. | Liu M, Zhu C, Yan C . Relationship between methylenetetrahydrofolate reductase gene polymorphism and homocysteine in type 1 diabetic microvascular complications. Zhonghua Er Ke Za Zhi 2003; 41(7):555-6. doi: 10.1023/A:1022289509702. |
| 12. | Mrozikiewicz-Rakowska B, Lukawska M, Nehring P , et al. Genetic predictors associated with diabetic retinopathy in patients with diabetic foot. Pol Arch Intern Med 2018; 128(1):35-42. doi: 10.20452/pamw.4144. |
| 13. | Vaccaro O, Perna AF, Mancini FP , et al. Plasma homocysteine and its determinants in diabetic retinopathy. Diabetes Care 2000; 23(7):1026-7. doi: 10.2337/diacare.23.7.1026. |
| 14. | Tawfik A, Markand S, Al-Shabrawey M , et al. Alterations of retinal vasculature in cystathionine-beta-synthase heterozygous mice: a model of mild to moderate hyperhomocysteinemia. Am J Pathol 2014; 184(9):2573-85. doi: 10.1016/j.ajpath.2014.05.018. |
| 15. | Egger M, Zellweger-Zahner T, Schneider M , et al. Language bias in randomised controlled trials published in English and German. Lancet 1997; 350(9074):326-9. doi: 10.1016/S0140-6736(97)02419-7. |
| 16. | Fekih-Mrissa N, Mrad M, Ibrahim H , et al. Methylenetetrahydrofolate reductase (MTHFR) (C677T and A1298C) polymorphisms and vascular complications in patients with type 2 diabetes. Can J Diabetes 2017; 41(4):366-71. doi: 10.1016/j.jcjd.2016.11.007. |
| 17. | Xing G, Xu H, Xu BX , et al. Correlation analysis of methylenetetrahydrofolate reductase (MTHFR) gene polymorphism and diabetic microvascular complications. J Med Forum 2016; ( 11):20-4. |
| 18. | Wei J, Wang LJ, Wang JJ , et al. Association between genetic polymorphisms of serum methyl groups and diabetic complications. South China J Prev Med 2012; 38(2):1-5. |
| 19. | Sun WW . Study on the relationship between methylenetetrahydrofolate reductase gene polymorphism and diabetic microangiopathy [dissertation]. Beijing: Capital Medical School; 2014. |
| 20. | Guo QH, Lu JM, Qin HH , et al. Changes of the plasma homocysteine and its mechanism in type 2 diabetes with microangiopathy. Chin J Diabetes 2002; 10(1):30-4. doi: 10.3321/j.issn:1006-6187.2002.01.009. |
| 21. | Wang LQ, Wang JY, Xue YM , et al. Relationship between methylenetetahydrofolate reductase gene polymorphism and diabetic retinopathy. Chin J Ocul Fundus Dis 2001; 17(3):31-3. doi: 10.3760/j.issn:1005-1015.2001.03.010. |
| 22. | Yang GQ, Lu JM, Pan CY . Study on the relationship between N5, 10-methyleneterahydrofolate reductase gene polymorphism and the susceptibility to microangiopathy in type 2 diabetes mellitus. Chin J Endocrinol Metab 2001; 16(4):36-9. doi: 10.3760/j.issn:1000-6699.2001.04.012. |
| 23. | Sun JZ, Xu YC, Zhu YL , et al. A study of association of polymorphism of methylenetetrahydrofolate reductase gene and diabetic microangiopathy. J Clin Intern Med 2003; 20(12):628-30. doi: 10.3969/j.issn.1001-9057.2003.12.004. |
| 24. | Huang DF, Cao H, Mao L , et al. The relationship of homocysteine, methylenetetrahydrofolate reductase gene polymorphism and diabetic reitinopathy. J Chin Microcirculation 2005; 9(4):229-31. |
| 25. | Yi XX, Yu YG, Zhan YJ , et al. The study on TCM syndrome differentiation of DR and the correlation between its syndroms and types and gene polymorphism. China J Chin Ophthalmol 2005; 15(3):125-8. doi: 10.3969/j.issn.1002-4379.2005.03.001. |
| 26. | Liu DM, Fan XP, Sun Y , et al. Study on the relationship between homocysteine &N5, 10-methylenetrahydrofolate reductase and diabetic retinopathy. Tianjin Med J 2006; 34(1):4-6. doi: 10.3969/j.issn.0253-9896. 2006.01.002. |
| 27. | Ren M . The analysis of risk factors and susceptibility genes of type 2 diabetic retinopathy [dissertation]. Tianjin: Tianjin Medical University; 2011. |
| 28. | Santos KG, Tschiedel B, Schneider J , et al. Diabetic retinopathy in Euro-Brazilian type 2 diabetic patients: relationship with polymorphisms in the aldose reductase, the plasminogen activator inhibitor-1 and the methylenetetrahydrofolate reductase genes. Diabetes Res Clin Pract 2003; 61(2):133-6. doi: 10.1016/S0168-8227(03)00112-8. |
| 29. | Errera FI, Silva ME, Yeh E , et al. Effect of polymorphisms of the MTHFR and APOE genes on susceptibility to diabetes and severity of diabetic retinopathy in Brazilian patients. Braz J Med Biol Res 2006; 39(7):883-8. doi: 10.1590/S0100-879X2006000700005. |
| 30. | Maeda M, Yamamoto I, Fukuda M , et al. MTHFR gene polymorphism is susceptible to diabetic retinopathy but not to diabetic nephropathy in Japanese type 2 diabetic patients. J Diabetes Complications 2008; 22(2):119-25. doi: 10.1016/j.jdiacomp.2006.12.002. |
| 31. | Yigit S, Karakus N, Inanir A . Association of MTHFR gene C677T mutation with diabetic peripheral neuropathy and diabetic retinopathy. MolVis 2013; 19(30):1626-30. |
| 32. | Yoshioka K, Yoshida T, Takakura Y , et al. No association between the MTHFR gene polymorphism and diabetic retinopathy in type 2 diabetic patients without overt nephropathy. Diabetes Care 2003; 26(6):1947-8. doi: 10.2337/diacare.26.6.1947. |
| 33. | Maeda M, Yamamoto I, Fukuda M , et al. MTHFR gene polymorphism as a risk factor for diabetic retinopathy in type 2 diabetic patients without serum creatinine elevation. Diabetes Care 2003; 26(2):547-8. doi: 10.2337/diacare.26.2.547-a. |
| 34. | Neugebauer S, Baba T, Watanabe T . Methylenetetrahydrofolate reductase gene polymorphism as a risk factor for diabetic nephropathy in NIDDM patients. Lancet 1998; 352(9126):454. doi: 10.1016/S0140-6736(05)79188-1. |
| 35. | Lauszus FF, Gron PL, Klebe JG . Association of polymorphism of methylene-tetrahydro-folate-reductase with urinary albumin excretion rate in type 1 diabetes mellitus but not with preeclampsia, retinopathy, and preterm delivery. Acta Obstet Gynecol Scand 2001; 80(9):803-6. doi: 10.1080/j.1600-0412.2001.080009803.x. |
| 36. | Ukinc K, Ersoz HO, Karahan C , et al. Methyltetrahydrofolate reductase C677T gene mutation and hyperhomocysteinemia as a novel risk factor for diabetic nephropathy. Endocrine 2009; 36(2):255-61. doi: 10.1007/s12020-009-9218-7. |
| 37. | Safi SZ, Qvist R, Kumar S , et al. Molecular mechanisms of diabetic retinopathy, general preventive strategies, and novel therapeutic targets. Biomed Res Int 2014; 2014:801269. doi: 10.1155/2014/801269. |
| 38. | Wiltshire EJ, Mohsin F, Chan A , et al. Methylenetetrahydrofolate reductase and methionine synthase reductase gene polymorphisms and protection from microvascular complications in adolescents with type 1 diabetes. Pediatr Diabetes 2008; 9(4 Pt 2):348-53. doi: 10.1111/j.1399-5448.2008.00374.x. |
| 39. | Li YY, Yang XF, Gu H , et al. The Beijing Desheng Diabetic Eye Study: rationale, design, methodology and baseline data. Int J Ophthalmol 2018; 11(1):108-16. doi: 10.18240/ijo.2018.01.19. |
| 40. | Stewart LA, Clarke M, Rovers M , et al. Preferred Reporting Items for Systematic Review and Meta-Analyses of individual participant data: the PRISMA-IPD Statement. JAMA 2015; 313(16):1657-65. doi: 10.1001/jama.2015.3656. |
| 41. | Luo S, Wang F, Shi C , et al. A meta-analysis of association between methylenetetrahydrofolate reductase gene (MTHFR) 677C/T polymorphism and diabetic retinopathy. Int J Environ Res Public Health 2016; 13(8):806-21. doi: 10.3390/ijerph13080806. |
| 42. | Chen D, Wang J, Dan Z , et al. The relationship between methylenetetrahydrofolate reductase C677T polymorphism and diabetic retinopathy: a meta-analysis in multiethnic groups. Ophthalmic Genet 2018; 39(2):200-7. doi: 10.1080/13816810.2017.1401087. |
| Viewed | ||||||
|
Full text |
|
|||||
|
Abstract |
|
|||||
|