Chinese Medical Sciences Journal ›› 2020, Vol. 35 ›› Issue (4): 330-341.doi: 10.24920/003695
• Original Article • Previous Articles Next Articles
Identification of Potential Therapeutic Targets of Alzheimer’s Disease By Weighted Gene Co-Expression Network Analysis
Fan Zhang1, Siran Zhong1, Siman Yang1, Yuting Wei1, Jingjing Wang1, Jinlan Huang2, Dengpan Wu2, Zhenguo Zhong1, *( )
)
- 1Pharmacy School, Guangxi University of Chinese Medicine, Nanning 530200, China
2Jiangsu Key Laboratory of New Drug Research and Clinical Pharmacy, Pharmacy School, Xuzhou Medical University, Xuzhou, Jiangsu 221004, China
-
Received:2019-12-09Accepted:2020-05-06Published:2020-12-31Online:2020-09-28 -
Contact:Zhenguo Zhong E-mail:gxtcmuzzg@163.com
| The author screened high throughput gene expression data using WGCNA, identified 6 co-expression gene sets as the key module relating to AD; the ATP6V1A, SLC25A14 and OXCT1 were concluded as hub genes that contribute to AD pathogenesis through pathway of tricarboxylic acid (TCA) cycle. These results shed a light on the role of TCA cycle in AD pathogenesis and novel therapeutic targets for AD. |
Cite this article
Fan Zhang, Siran Zhong, Siman Yang, Yuting Wei, Jingjing Wang, Jinlan Huang, Dengpan Wu, Zhenguo Zhong. Identification of Potential Therapeutic Targets of Alzheimer’s Disease By Weighted Gene Co-Expression Network Analysis[J].Chinese Medical Sciences Journal, 2020, 35(4): 330-341.
share this article
Add to citation manager EndNote|Reference Manager|ProCite|BibTeX|RefWorks
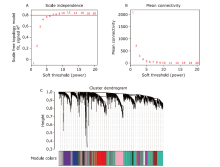
Figure 1.
Construction of co-expression network. (A) Analysis of network topology for various soft-thresholding powers. In this case, we chose the power of 6 which is the lowest power for the scale-free topology index reach 0.80. (B) Analysis of the mean connectivity showed the soft threshold of 7 was the fittest power value. (C) The clustering dendrogram of genes in GSE36980. The 27 colors below represents the corresponding co-expression modules."
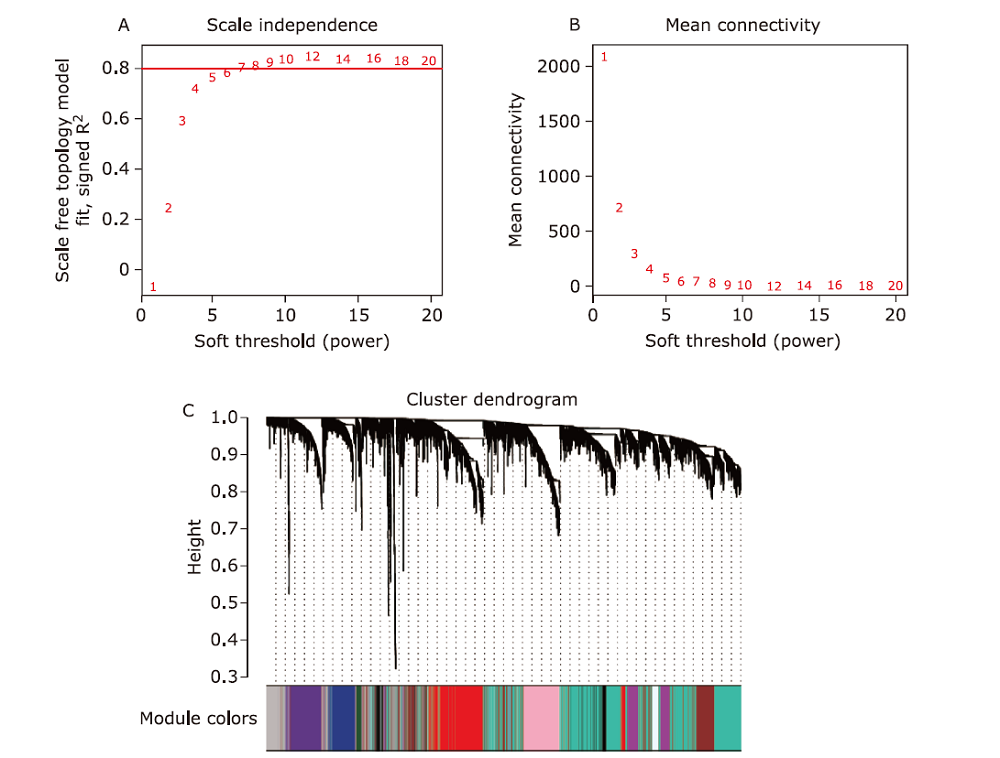
Figure 1.
Table 1
Modules and the number of genes in each module"
| Module | Gene number | Module | Gene number | Module | Gene number | Module | Gene number | |||
|---|---|---|---|---|---|---|---|---|---|---|
| grey | 813 | turquoise | 1852 | blue | 971 | brown | 947 | |||
| yellow | 943 | green | 691 | red | 683 | black | 421 | |||
| pink | 402 | magenta | 396 | purple | 357 | greenyellow | 281 | |||
| tan | 179 | salmon | 152 | cyan | 146 | midnightblue | 144 | |||
| lightcyan | 87 | grey60 | 74 | lightgreen | 69 | lightyellow | 62 | |||
| royalblue | 59 | darkred | 53 | darkgreen | 52 | darkturquoise | 50 | |||
| darkgrey | 45 | orange | 39 | darkorange | 32 |
Table 1
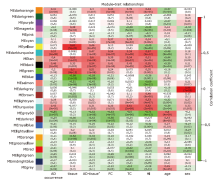
Figure 2.
Module-trait relationships heatmap of the expression matrix. Traits including AD occourence, age, sex, tissues from frontal cortex, hippocampus, and temporal cortex, and combination of tissue with AD occurence were analyses to explore the correlation with module genes expression. Each cell was the correlation coefficients(color coded) with the P value in parentheses. The modules correlated to the AD occurrence were taken for further analysis. FC, frontal cortex; TC, temporal cortex; HI, hippocampus. *combining the AD occurrence and the tissue together to explore expression change in tissues between AD and non-AD."
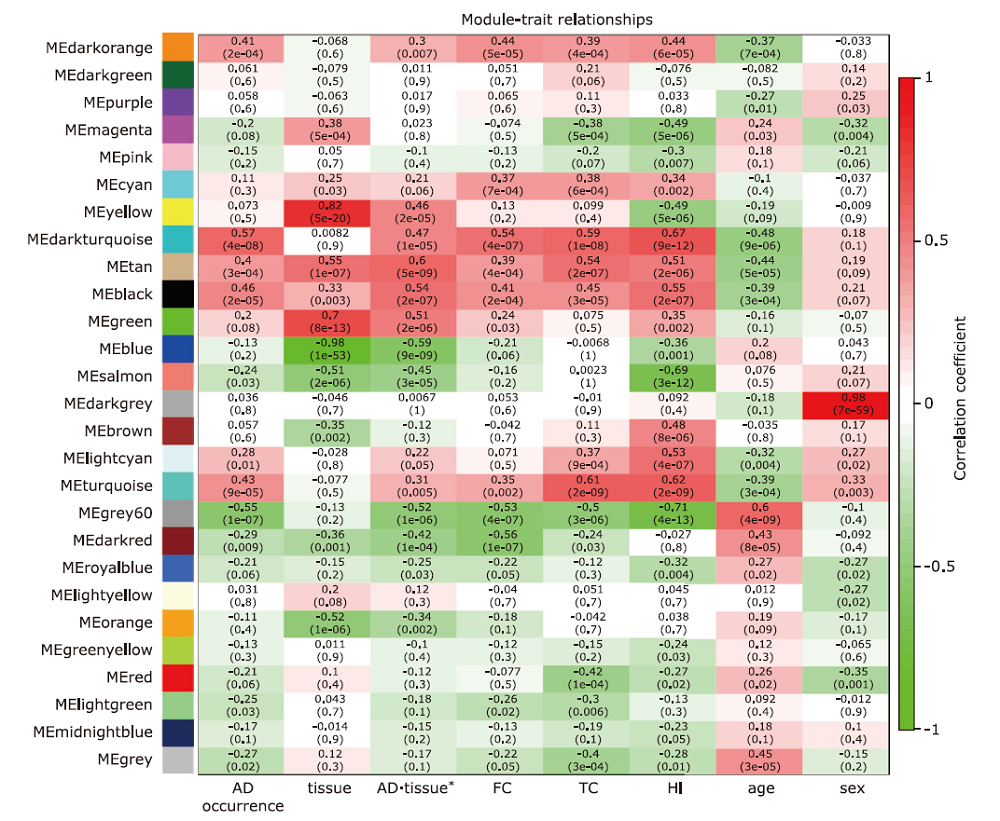
Figure 2.
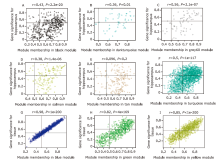
Figure 3.
GS and MM scatterplot and hub genes screening in the selected key modules (A) Black module, (B) darkturquoise module, (C) grey60 module, (D) salmon module, (E) tan module, and (F) turquoise module were the key modules which were significantly correlated to AD occurrence. (G) Blue module, (H) green module, and (I) yellow module were the selected key modules which can reveal differential expressed genes among different tissues (hippocampus, temporal cortex, frontal cortex). GS and MM were taken absolute values to locate the hub genes in the upper right corner of each plot. The key module were selected for hub genes screening based on the GS and MM vaule. GS, gene significance; MM, module membership."

Figure 3.

Figure 4.
Eigengene dendrogram and eigengene adjacency heatmap (A) Eigengene dendrogram representing the correlation among different modules and the clinical traits. (B) Correlation between each two modules was presented by color in the matrix according the color scale."
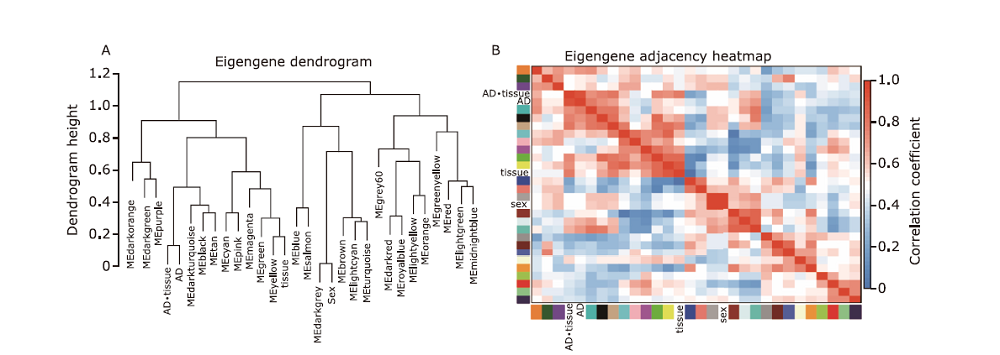
Figure 4.

Figure 5.
GO and KEGG enrichment analysis results of the black, tan and darkturquoise modules by Matescape database."
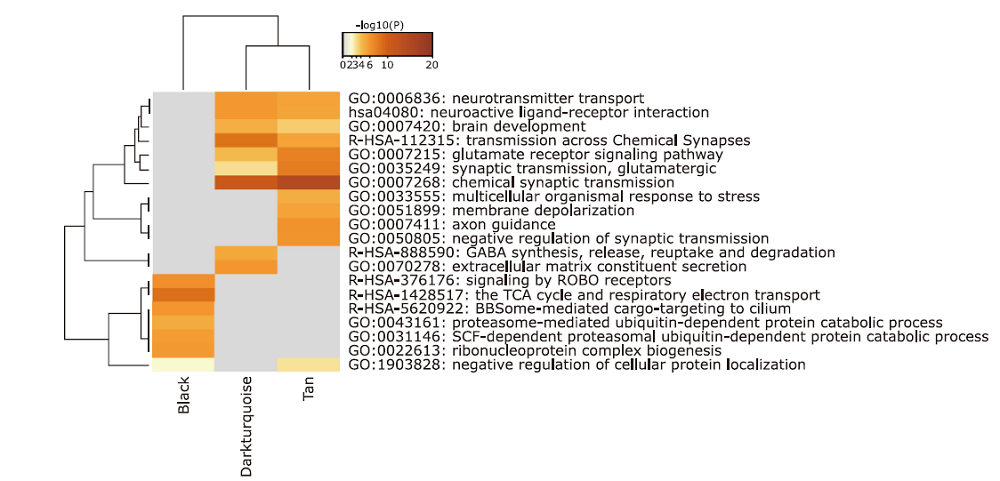
Figure 5.
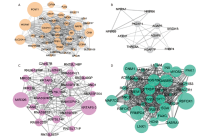
Figure 6.
Network analyses and hub genes visualization. (A) Hub genes in darkturquoise, tan and black modules. (B), (C) and (D) showed hub genes in grey60, salmon, and turquoise modules, respectively. Node size correlates to the connectivity degree of genes."

Figure 6.
Figure 7.
Visualization of protein-protein interaction (PPI) network analyses on genes of the darkturquoise, tan and black modules. (A) The entire PPI network of the darkturquoise module. (B) The PPI network of genes in the Tan modules. Tow hub network clusters sorted by MCODE scores were also shown. (C) The entire PPI network and network analysis of the black module. Two hub network clusters sorted by MCODE scores, and the sub-network of 10 hub genes with the highest connectivity degree in the PPI network of black module were also shown. Note: the nodes were sorted by MCODE scores according to the color scale bar."
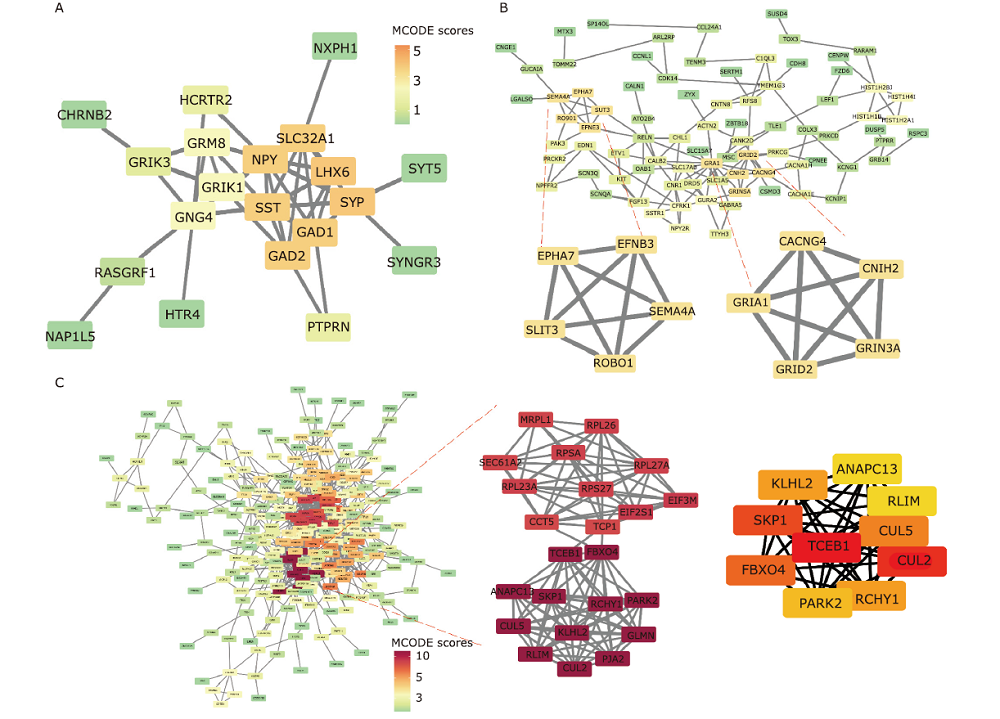
Figure 7.
Table 2
GO and KEGG analyses of the sub-network cluster in genes PPI network of black module§"
| Pathways | Description | Gene number | % | Log10(P) |
|---|---|---|---|---|
| R-HSA-983169 | Class I MHC mediated antigen processing & presentation | 13 | 61.90 | -18.41 |
| R-HSA-156827 | L13a-mediated translational silencing of Ceruloplasmin expression | 6 | 28.57 | -9.38 |
| GO:0032212 | positive regulation of telomere maintenance via telomerase | 3 | 14.29 | -5.48 |
| GO:0000209 | protein polyubiquitination | 5 | 23.81 | -5.24 |
| GO:0031396 | regulation of protein ubiquitination | 4 | 19.05 | -4.58 |
| GO:0097193 | intrinsic apoptotic signaling pathway | 4 | 19.05 | -3.99 |
| GO:0071478 | cellular response to radiation | 3 | 14.29 | -3.23 |
| GO:0051701 | interaction with host | 3 | 14.29 | -3.11 |
Table 2

Figure 8.
Validation of the hub genes in darkturquoise, tan and black modules with AD and its states using datasets of GSE1297 and GSE28146. (A) OXCT1 expression value and MMSE score correlation analysis and comparison between groups. (B) C3of14 expression value and MMSE score correlation analysis and comparison between groups. (C) WDR47, (D) SLC25A14, (E) ATP6V1A, (F)NAPB, (G) EPHA7, (H) RCHY1, (I) TCEB1, each gene expression compared among the controls and the incipent, moderate, and severe state of AD patients. *P<0.05, ** P<0.01."
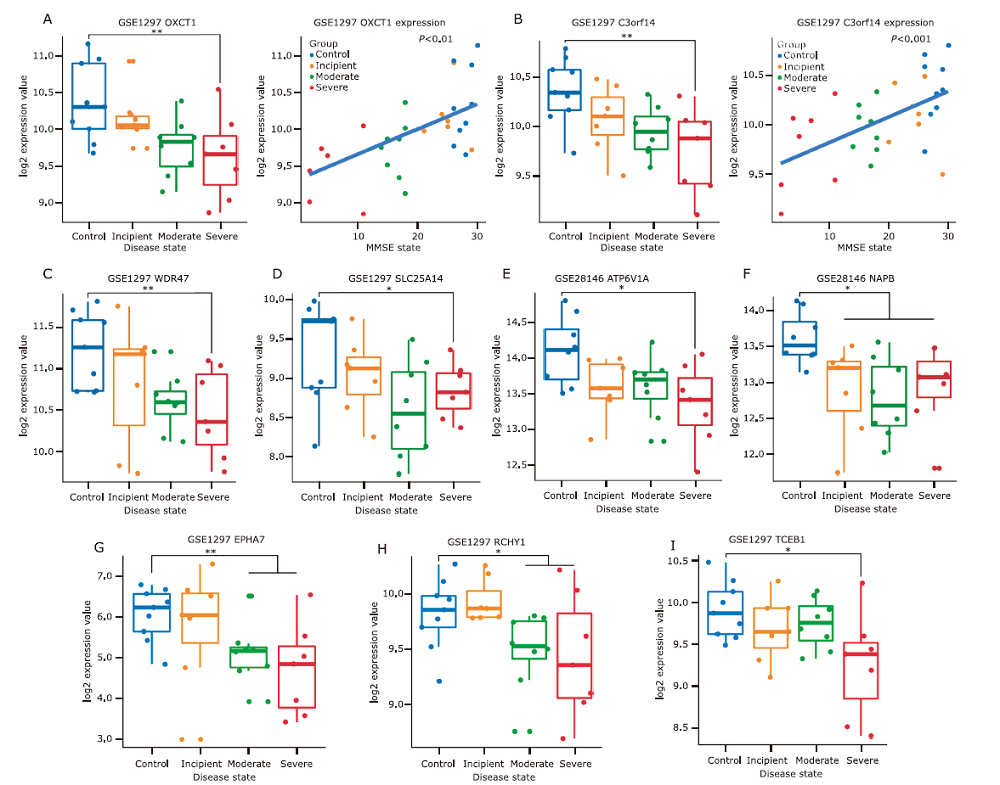
Figure 8.
| 1. |
Hardy J, Selkoe DJ. The amyloid hypothesis of Alzheimer’s disease: progress and problems on the road to therapeutics. Science 2002; 297(5580):353-6. doi: 10.1126/science.1072994.
doi: 10.1126/science.1072994 pmid: 12130773 |
| 2. |
Gouras GK, Tsai J, Naslund J, et al. Intraneuronal A-beta 42 accumulation in human brain. Am J Pathol 2000; 156(1):15-20. doi: 10.1016/s0002-9440(10)64700-1.
pmid: 10623648 |
| 3. | Williamson J, Goldman J, Marder KS. Genetic aspects of Alzheimer disease. Neurologist 2016; 15(2):80. doi: 10.1097/NRL.0b013e318187e76b. |
| 4. | Langfelder P, Horvath S. WGCNA: an R package for weighted correlation network analysis. BMC bioinforma-tics 2008; 9(1):559. doi: 10.1186/1471-2105-9-559. |
| 5. | Ritchie ME, Phipson B, Wu D, et al. Limma powers differential expression analyses for RNA-sequen-cing and microarray studies. Nucleic Acids Res 2015; 43(7):e47. doi: 10.1093/nar/gkv007. |
| 6. | Zhang B, Horvath S. A general framework for weighted gene co-expression newtork analysis. Sta Appl Genet Mol Biol 2005; 4:Article 17. doi: 10.2202/1544-6115.1128. |
| 7. | Zheng CH, Yuan L, Sha W, et al. Gene differential coexpression analysis based on biweight correlation and maximum clique. BMC bioinformatics 2014; 15(Suppl 15):S3. doi: 10.1186/1471-2105-15-S15-S3. |
| 8. |
Horvath S, Dong J, Miyano S. Geometric interpretation of gene coexpression network analysis. PLoS comput biol 2008; 4(8):e1000117. doi: 10.1371/journal.pcbi.1000117.
pmid: 18704157 |
| 9. | Zhou Y, Zhou B, Pache L, et al. Metascape provides a biologist-oriented resource for the analysis of systems-level datasets. Nat Commun 2019; 10(1):1523. doi: 10.1038/s41467-019-09234-6. |
| 10. |
Shannon P. Cytoscape: a software environment for integrated models of biomolecular interaction networks. Genome Res 2003; 13(11):2498. doi: 10.1101/gr.1239303.
pmid: 14597658 |
| 11. | Szklarczyk D, Franceschini A, Kuhn M, et al. The STRING database in 2011: functional interaction networks of proteins, globally integrated and scored. Nucleic Acids Res 2011; 39(database issue):D561-8. doi: 10.1093/nar/gkq973. |
| 12. |
Liu ZP, Wang Y, Zhang XS, et al. Network-based ana-lysis of complex diseases. IET Syst Biol 2012; 6(1):22-33. doi: 10.3390/ iet-syb.2010.0052.
pmid: 22360268 |
| 13. | Liu ZP, Wang Y, Zhang XS, et al. Detecting and analyzing differentially activated pathways in brain regions of Alzheimer’s disease patients. Mol Bio Syst 2011; 7(5):1441-52. doi: 10.1039/c0mb00325e. |
| 14. | Liu ZP, Wang Y, Zhang XS, et al. Identifying dysfunctional crosstalk of pathways in various regions of Alzheimer’s disease brains. BMC Syst Biol 2010; 4(Suppl 2):S11. doi: 10.1186/1752-0509-4-S2-S11. |
| 15. | Ficz G. New insights into mechanisms that regulate DNA methylation patterning. J Exp Biol 2015; 218(Pt 1):14-20. doi: 10.1242/jeb.107961. |
| 16. | Yu NK, Beak SH, Kaang BK. DNA methylation-mediated control of learning and memory. Mol Brain 2011; 4:5. doi: 10.1186/1756-6606-4-5. |
| 17. |
Lando M, Fjeldbo CS, Wilting SM, et al. Interplay between promoter methylation and chromosomal loss in gene silencing at 3p11-p14 in cervical cancer. Epigenetics 2015; 10(10):970-80. doi: 10.1080/15592294.2015.1085140.
doi: 10.1080/15592294.2015.1085140 pmid: 26291246 |
| 18. | Van GM, Baranger K, Benech P, et al. Metabolic changes and inflammation in cultured astrocytes from the 5xFAD mouse model of Alzheimer’s disease: Alleviation by pantethine. PloS One 2018; 12(4):e0175369. doi: 10.1371/journal.pone.0175369. |
| 19. |
Akihiro Y, Takagi H, Kimata D, et al. Deficiency in protein L-iso-aspartyl methyltaransferase results in a fatal progressive epilepsy. J Neurosci 1998; 18(6):2063-74. doi: 10.1016/S0165-5728(97)00232-4.
pmid: 9482793 |
| 20. |
Shimizu T, Watanabe A, Ogawara M, et al. Isoaspartate formation and neurodegeneration in Alzheimer’s disease. Arch Biochem Biophys 2000; 381(2):225-34. doi: 10.1006/abbi.2000.1955.
pmid: 11032409 |
| 21. |
Pawlosky RJ, Kemper MF, Kashiwaya Y, et al. Effects of a dietary ketone ester on hippocampal glycolytic and tricarboxylic acid cycle intermediates and amino acids in a 3xTgAD mouse model of Alzheimer’s disease. J Neurochem 2017; 141(2):195-207. doi: 10.1111/jnc.13958.
doi: 10.1111/jnc.2017.141.issue-2 pmid: 28099989 |
| 22. | Russell H. Swerdlow. Mitochondria and mitochondrial cascades in Alzheimer’s disease. J Alzheimers Dis 2017; 62(3):1403-16. doi: 10.3233/JAD-170585. |
| 23. |
Han Y, Chu X, Cui L, et al. Neuronal mitochondria-targeted therapy for Alzheimer’s disease by systemic delivery of resveratrol using dual-modified novel biomimetic nanosystems. Drug Deliv 2020; 27(1):502-18. doi: 10.1080/10717544.2020.1745328.
doi: 10.1080/10717544.2020.1745328 pmid: 32228100 |
| 24. | Gao C, Wang Y, Sun J, et al. Neuronal mitochondria-targeted delivery of curcumin by biomimetic engineered nanosystems in Alzheimer’s disease mice. Acta Biomater 2020; 108:285-99. doi: 10.1016/j.actbio.2020.03.029. |
| 25. |
Khosravi S, Harner ME. The MICOS complex, a structural element of mitochondria with versatile functions. Biol Chem 2020; 401(6-7):765-78. doi: 10.1515/hsz-2020-0103.
doi: 10.1515/hsz-2020-0103 pmid: 32229686 |
| 26. |
van Gijsel-Bonnello M, Baranger K, Benech P, et al. Metabolic changes and inflammation in cultured astrocytes from the 5xFAD mouse model of Alzheimer’s disease: Alleviation by pantethine. PLoS One 2017; 12(4):e0175369. doi: 10.1371/journal.pone.0175369. Erratum in PLoS One 2018; 13(3):e0194586.
doi: 10.1371/journal.pone.0175369 pmid: 28410378 |
| 27. |
Dong Y, Brewer GJ. Global metabolic shifts in age and Alzheimer’s disease mouse brains pivot at NAD+/NADH redox sites. J Alzheimers Dis 2019; 71(1):119-40. doi: 10.3233/JAD-190408.
doi: 10.3233/JAD-190408 pmid: 31356210 |
| 28. |
Fassio A, Esposito A, Kato M, et al. De novo mutations of the ATP6V1A gene cause developmental encephalopathy with epilepsy. Brain 2018; 141(6):1703-18. doi: 10.1093/brain/awy092.
doi: 10.1093/brain/awy092 pmid: 29668857 |
| 29. |
Palmieri F. The mitochondrial transporter family SLC25: identification, properties and physiopathology. Mol Aspects Med 2013; 34(2-3):465-84. doi: 10.1016/j.mam.2012.05.005.
doi: 10.1016/j.mam.2012.05.005 pmid: 23266187 |
| 30. |
Anitha A, Nakamura K, Thanseem I, et al. Brain region-specific altered expression and association of mitochondria-related genes in autism. Mol Autism 2012; 3(1):12. doi: 10.1186/2040-2392-3-12.
doi: 10.1186/2040-2392-3-12 pmid: 23116158 |
| 31. |
Shafqat N, Kavanagh KL, Sass JO, et al. A structural mapping of mutations causing succinyl-CoA:3-ketoacid CoA transferase (SCOT) deficiency. J Inherit Metab Dis 2013; 36(6):983-7. doi: 10.1007/s10545-013-9589-z.
doi: 10.1007/s10545-013-9589-z pmid: 23420214 |
| [1] | Dong Liling, Liu Caiyan, Mao Chenhui, Chu Shanshan, Li Jie, Huang Xinying, Gao Jing. Linguistic Characteristics of Mandarin-Speaking Huntington’s Disease Patients [J]. Chinese Medical Sciences Journal, 2020, 35(3): 207-214. |
| [2] | Shi Xinze, Wei Xuan, Sha Longze, Xu Qi. Comparison of β-Amyloid Plaque Labeling Methods: Antibody Staining, Gallyas Silver Staining, and Thioflavin-S Staining [J]. Chinese Medical Sciences Journal, 2018, 33(3): 167-173. |
| Viewed | ||||||
|
Full text |
|
|||||
|
Abstract |
|
|||||
|