Chinese Medical Sciences Journal ›› 2020, Vol. 35 ›› Issue (1): 71-84.doi: 10.24920/003535
荟萃分析:亚甲基四氢叶酸还原酶基因C677T(MTHFR-C677T)多态性与糖尿病视网膜病变(DR)的关系
沈畅,赵萌,李芸云,刘宁朴( )
)
- 首都医科大学附属北京同仁医院 北京同仁眼科中心 北京市眼科学与视觉科学重点实验室,北京 100730
-
收稿日期:2019-06-02出版日期:2020-03-31发布日期:2020-04-16 -
通讯作者:刘宁朴 E-mail:nliu001@yeah.net
Methylenetrahydrofolate Reductase Gene C677T Polymorphism and Diabetic Retinopathy: a Meta-Analysis
Shen Chang,Zhao Meng,Li Yunyun,Liu Ningpu()
- Beijing Tongren Eye Center & Beijing Ophthalmology and Visual Sciences Key Laboratory, Beijing Tongren Hospital, Capital Medical University, Beijing 100730, China
-
Received:2019-06-02Published:2020-03-31Online:2020-04-16 -
Contact:Liu Ningpu E-mail:nliu001@yeah.net
摘要:
目的 探讨亚甲基四氢叶酸还原酶基因C677T(MTHFR-C677T)多态性与糖尿病视网膜病变(DR)的关系。
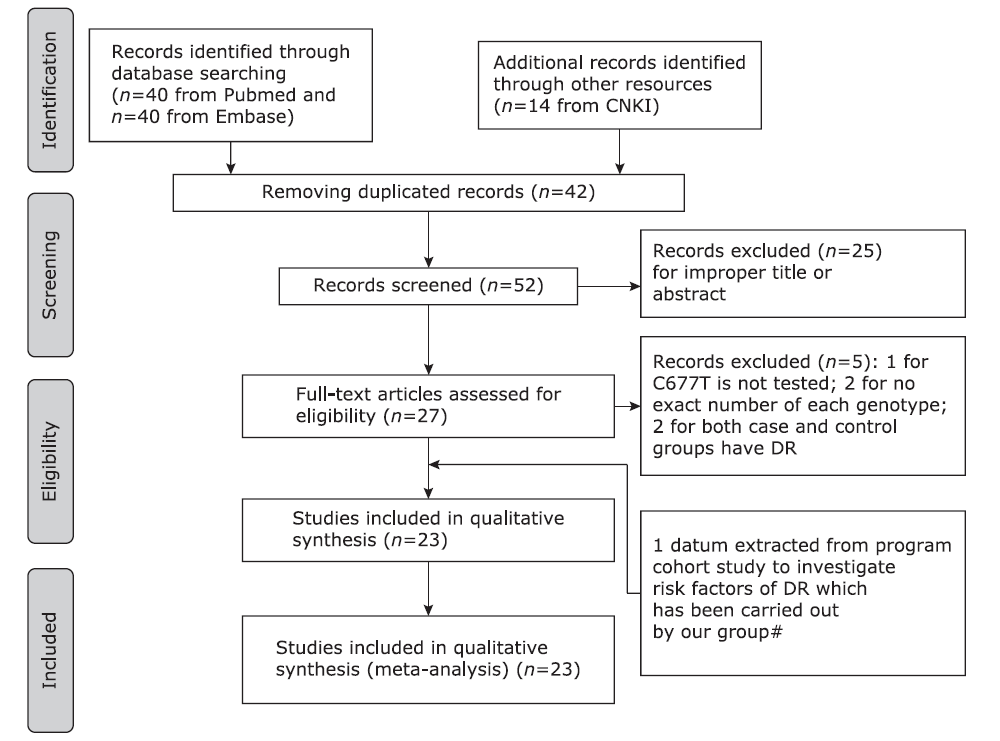
方法 本研究共纳入23项研究共6971名受试者,其中DR患者2707例,对照4264名。应用随机效应模型估计MTHFR基因C677T多态性对DR风险的总体效应和分层效应,并对研究质量进行评价。
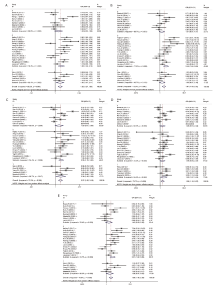
结果 MTHFR基因C677T多态性与DR密切相关。DR组与健康对照相比,MTHFR-C677T突变发生的比值比在等位基因对比模型(95%CI:1.29-2.18,P<0.001,I 2=78.4%)、显性模型(95%CI:1.62-3.29,P<0.001,I 2=74.7%)和纯合子模型(95%CI:1.70-3.83,P=0.008,I 2=54.4%)中分别为1.68、2.55和2.31。DR组与非复杂糖尿病组相比,MTHFR-C677T突变发生的比值比在等位基因对比模型中为1.50(95%CI:1.07-2.11,P=0.032,I 2=62.1%),在纯合子模型中为2.39(95%CI:1.06-5.38,P=0.017,I 2=66.7%),在显性模型中为1.59(95%CI:0.97-2.62,P=0.056,I 2=56.5%)。在杂合子模型中,DR组与健康对照组相比,MTHFR-C677T突变的发生的比值比为1.46(95%CI:1.64-3.69,P=0,I 2=77.3%),而杂合子模型中,DR组与非复杂糖尿病组相比,MTHFR-C677T突变发生的差异无统计学意义(OR=1.38,95%CI:0.87-2.18,P=0.356,I 2=3.1%)。在隐性模型中,DR组与非复杂糖尿病组相比,MTHFR-C677T突变发生的比值比为1.92(95%CI:1.07-3.43,P=0.064,I 2=55%)。DR组与糖尿病对照组相比,发生MTHFR-C677T突变的差异在各模型中均无有统计学意义。
结论 MTHFR基因C677T多态性与DR存在相关性,尤其与非复杂糖尿病对照组相比。今后需要进一步的研究以明确这种关系。
引用本文
Shen Chang, Zhao Meng, Li Yunyun, Liu Ningpu. Methylenetrahydrofolate Reductase Gene C677T Polymorphism and Diabetic Retinopathy: a Meta-Analysis[J].Chinese Medical Sciences Journal, 2020, 35(1): 71-84.
"
| Criteria | Score |
|---|---|
| Representativeness of cases | |
| DR diagnosed according to ETDRS | 2 |
| DR diagnosed according to other DR criteria | 1.5 |
| DR diagnosed according to doctors’ assessments | 1 |
| Not mentioned | 0 |
| Source of controls | |
| Population or community based | 3 |
| Hospital-based DM-free controls | 2 |
| DR-free DM patients without other complications | 1 |
| DR-free DM patients with other complications | 0.5 |
| Not described | 1 |
| Sample size (n) | |
| >200 | 2 |
| 100-200 | 1 |
| <100 | 0 |
| Quality control of genotyping methods | |
| Repetition of partial/total tested samples with a different method | 2 |
| Repetition of partial/total tested samples with the same method | 1 |
| Not described | 0 |
| Hardy-Weinberg equilibrium | |
| Hardy-Weinberg equilibrium in control subjects | 1 |
| Hardy-Weinberg disequilibrium in control subjects | 0 |
| Quality scores | 10 |

"
"
| Clinical characteristics | Ncd group (n=212) | DR group (n=262) | P value |
|---|---|---|---|
| Age of diabetic onset (yrs) | 53.12±7.68 | 50.75±9.09 | 0.001 |
| Sex (Male/Female, n) | 85/127 | 121/141 | 0.184 |
| Duration of diabetes (yrs) | 14.67±4.73 | 13.96±7.25 | 0.203 |
| BMI (kg/m2) | 25.18±3.97 | 25.58±3.94 | 0.275 |
| WHR | 0.92±0.06 | 0.93±0.06 | 0.295 |
| High albuminuria (-/+, n) | 181/28 | 188/69 | <0.001 |
| Systolic blood pressure (mm Hg) | 136.96±1.46 | 137.92±17.14 | 0.539 |
| Diastolic blood pressure (mm Hg) | 77.82±9.51 | 78.91±9.43 | 0.211 |
| Insulin therapy (yes/no, n) | 65/147 | 136/125 | <0.001 |
| HbA1c (%) | 6.96±1.32 | 7.62±1.73 | <0.001 |
| FPG (mmol/L) | 8.02±2.31 | 8.89±3.06 | 0.001 |
| Creatinine (µmol/L) | 67.81±17.93 | 73.56±47.56 | 0.096 |
| Uric acid (µmol/L) | 281.72±79.24 | 279.40±76.15 | 0.844 |
| Cholesterol (mmol/L) | 5.07±0.97 | 5.13±1.13 | 0.728 |
| Triglycerides (mmol/L) | 1.58±0.99 | 1.63±1.34 | 0.682 |
| HDLC (mmol/L) | 1.23±0.29 | 1.23±0.30 | 0.988 |
| LDLC (mmol/L) | 3.08±0.83 | 3.07±0.90 | 0.682 |
"
| References | Year of publication | Race | Case | Control | |||||||||||||
|---|---|---|---|---|---|---|---|---|---|---|---|---|---|---|---|---|---|
| Sample size (n) | Age (yrs) | DM duration (yrs) | Definition of case | DR diagnosis | Sample size (n) | Age (yrs) | DM§ duration (yrs) | Defination of control | DM type | HWE* | MAF* | NOS | Quality assessment | ||||
| Beata et al.[ | 2017 | European | 64 | 62.8±9.7 | 16.97±9.2 | DR with DF | ETDRS | 50 | 65.7±9.7 | 17.1±9.48 | DM | T2DM | 0.64 | 0.73 | 5 | 4.5 | |
| Najiba et al.[ | 2017 | American | 44 | 50.4±12.92 (all) | 8.98±6.9 | DR | NM | 200 | 50.5±12.77 | NA | healthy | T2DM | 0.72 | 0.21 | 5 | 5 | |
| Xing et al.[ | 2016 | Chinese | 76 | NM | NM | DR with/without DN | OC | 56 | no | NA | healthy | T2DM | 0.009 | 0.32 | 6 | 4.5 | |
| Wei et al.[ | 2012 | Chinese | 61 | 59.3±12.7 | 6(median) | DR | OC | 64 | 58.3±14.1 | 4(median) | Ncd | T2DM | 0.254 | 0.258 | 6 | 4.5 | |
| Sun et al.[ | 2014 | Chinese | 176 | 62.38±8.15 | 16.36±6.47 | DR | DA | 241 | 62.95±8.71 | 12.82±6.1 | DM | T2DM | 0.99 | 0.624 | 6 | 4.5 | |
| Guo et al.[ | 2002 | Chinese | 52 | 54.63±12.04 | 4.5 (3.0-8.0) | DR | OC | 28 | 56.57±10.75 | NA | healthy | T2DM | 0.39 | 0.375 | 5 | 4.5 | |
| Guo et al.[ | 2002 | Chinese | 52 | 54.63±12.04 | 4.5 (3.0-8.0) | DR | OC | 52 | 55.17±6.87 | 15(median) | Ncd | T2DM | 0.43 | 0.45 | 5 | 4.5 | |
| Wang et al.[ | 2001 | Chinese | 62 | 62.5±8.08 | 8.29±6.39 | DR | OC | 117 | 59.42±14.87 | 7.28±5.8 | DM | T2DM | 0.68 | 0.3 | 7 | 4 | |
| Wang et al.[ | 2001 | Chinese | 62 | 62.5±8.08 | 8.29±6.39 | DR | OC | 85 | 41.83±17.1 | NA | healthy | T2DM | 0 | 0.73 | 7 | 3.5 | |
| Yang et al.[ | 2001 | Chinese | 60 | 50.7±12.1 | <5 | DR | DA | 102 | 48±8.2 | >10 | Ncd | T2DM | 0.17 | 0.41 | 6 | 4 | |
| Yang et al.[ | 2001 | Chinese | 60 | 50.7±12.1 | <5 | DR | DA | 62 | 52.6±14.9 | NA | healthy | T2DM | 0.91 | 0.35 | 6 | 5 | |
| Sun et al.[ | 2003 | Chinese | 110 | 55.6±6.7 | <5 | DR | OC | 98 | 54.7±7.1 | >10 | DM | T2DM | 0 | 0.33 | 7 | 4 | |
| Sun et al.[ | 2003 | Chinese | 110 | 55.6±6.7 | <5 | DR | OC | 57 | 42.3±6.1 | NA | healthy | T2DM | 0 | 0.31 | 7 | 4.5 | |
| Huang et al.[ | 2005 | Chinese | 50 | NM | NM | DR (72% with DN) | OC | 47 | no | NA | healthy | T2DM | 0.96 | 0.25 | 5 | 4.5 | |
| Yi et al.[ | 2005 | Chinese | 245 | 56.53±10.45 | 5.9±4.8 | DR (27% with protein urine) | OC | 65 | no | NA | healthy | T2DM | 0.01 | 0.31 | 4 | 3.5 | |
| Liu et al.[ | 2006 | Chinese | 44 | 51.9±7.5 | NM | DR | DA | 84 | 54.0±13.2 | NA | healthy | T2DM | 0.01 | 0.25 | 6 | 4 | |
| Ren et al.[ | 2011 | Chinese | 219 | 59.95±10.55 | 11(median) | DR | DA | 294 | 58.52±12.26 | 7 (median) | DM | T2DM | 0.23 | 0.41 | 6 | 4.5 | |
| Santos et al.[ | 2003 | American | 99 | 58.7±12(all) | 14.9 (median) | DR | OC | 111 | 58.7±12 (all) | 6.6 (median) | DM | T2DM | 0.98 | 0.39 | 5 | 5 | |
| Errara et al.[ | 2003 | American | 46 | 55.43±15.33 | 18±8.67 | DR(NPDR81, PDR60) | OC | 106 | 66.11±7.06 | NA | healthy | T1DM | 0.24 | 0.39 | 4 | 5.5 | |
| Errara et al.[ | 2003 | American | 95 | 55.43±15.33 | 18±8.67 | DR(NPDR81, PDR60) | OC | 106 | 66.11±7.06 | NA | healthy | T2DM | 0.24 | 0.39 | 4 | 6.5 | |
| Maeda et al.[ | 2008 | Japanese | 75 | NM | NM | DR | OC | 115 | NM | NM | DM | T2DM | 0.06 | 0.35 | 5 | 4 | |
| Yigit et al.[ | 2013 | West Asian | 230 | 57.15±10.58 | 7.73±6.006 | DPN(81DR+DN, 129DN) | ETDRS | 282 | 55.55±8.14 | NA | healthy | T1DM+T2DM | 0.46 | 0.19 | 6 | 6 | |
| Yosioka et al.[ | 2003 | Japanese | 98 | 60 (median) | 11.7 (median) | DR(52NPDR, 46PDR) | NM | 268 | 60 | 11.7 | Ncd | T2DM | 0.46 | 0.38 | 4 | 4 | |
| Maeda et al.[ | 2003 | Japanese | 51 | NM | NM | DR(33NPDR) | OC | 105 | NM | NM | Ncd | T2DM | 0.06 | 0.37 | 4 | 4 | |
| Neugebauer et al.[ | 1998 | Japanese | 67 | 57-61 | 14-16 | DR with DN | NM | 146 | 39-43 | NA | healthy | T2DM | 0.003 | 0.26 | 6 | 4 | |
| Lauszus et al.[ | 2001 | European | 112 | NM | NM | DR(T1DM pregnant) | OC | 1084 | NA | NA | healthy | T2DM | 0.53 | 0.29 | 4 | 6 | |
| Ukinc et al.[ | 2009 | West Asian | 25 | 52.7±9.9 (all) | 7.6±6.2 (all) | DR | OC | 27 | 52.7±9.9 (all) | 7.6±6.2 (all) | DM | T1DM | 0.09 | 0.24 | 4 | 2.5 | |
| Liu et al.# | 2017 | Chinese | 262 | 66.69±8.28 | 14.40±6.51 | DR(18.1% with microalbuminuria) | ETDRS | 212 | 65.37±7.46 | 14.32±6.11 | DM | T2DM | 0.34 | 0.57 | 8 | 8 | |
"
| References | Year of publication | CC | CT | TT | C | T | |||||||||
|---|---|---|---|---|---|---|---|---|---|---|---|---|---|---|---|
| Case | Control | Case | Control | Case | Control | Case | Control | Case | Control | ||||||
| Beata et al.[ | 2017 | 6 | 3 | 30 | 21 | 28 | 26 | 42 | 27 | 86 | 73 | ||||
| Najiba et al.[ | 2017 | 8 | 124 | 36 | 68 | 0 | 8 | 52 | 316 | 36 | 84 | ||||
| Xing et al.[ | 2016 | 17 | 30 | 40 | 16 | 19 | 10 | 74 | 76 | 78 | 36 | ||||
| Wei et al.[ | 2012 | 33 | 37 | 25 | 21 | 3 | 6 | 91 | 95 | 31 | 33 | ||||
| Sun et al.[ | 2014 | 28 | 34 | 88 | 113 | 60 | 94 | 144 | 181 | 208 | 301 | ||||
| Guo et al.[ | 2002 | 5 | 12 | 23 | 11 | 24 | 5 | 33 | 35 | 71 | 21 | ||||
| Guo et al.[ | 2002 | 5 | 17 | 23 | 23 | 24 | 12 | 33 | 57 | 71 | 47 | ||||
| Wang et al.[ | 2001 | 8 | 57 | 27 | 48 | 27 | 12 | 43 | 162 | 81 | 72 | ||||
| Wang et al.[ | 2001 | 8 | 38 | 27 | 10 | 27 | 112 | 43 | 86 | 81 | 234 | ||||
| Yang et al.[ | 2001 | 8 | 32 | 33 | 56 | 19 | 14 | 49 | 120 | 71 | 84 | ||||
| Yang et al.[ | 2001 | 8 | 26 | 33 | 28 | 19 | 8 | 49 | 80 | 71 | 44 | ||||
| Sun et al.[ | 2003 | 33 | 51 | 46 | 29 | 31 | 18 | 112 | 131 | 108 | 65 | ||||
| Sun et al.[ | 2003 | 33 | 31 | 46 | 16 | 31 | 10 | 112 | 78 | 108 | 36 | ||||
| Huang et al.[ | 2005 | 17 | 26 | 25 | 18 | 8 | 3 | 59 | 41 | 70 | 24 | ||||
| Yi et al.[ | 2005 | 68 | 35 | 110 | 19 | 71 | 11 | 246 | 89 | 252 | 41 | ||||
| Liu et al.[ | 2006 | 18 | 47 | 16 | 25 | 10 | 12 | 52 | 119 | 36 | 49 | ||||
| Ren et al.[ | 2011 | 26 | 77 | 78 | 95 | 57 | 41 | 130 | 249 | 192 | 177 | ||||
| Santos et al.[ | 2003 | 34 | 41 | 53 | 53 | 12 | 17 | 121 | 135 | 77 | 87 | ||||
| Errara et al.[ | 2003 | 17 | 36 | 25 | 57 | 4 | 14 | 59 | 129 | 33 | 85 | ||||
| Errara et al.[ | 2003 | 44 | 36 | 41 | 57 | 10 | 14 | 129 | 129 | 61 | 85 | ||||
| Maeda et al.[ | 2008 | 31 | 43 | 28 | 62 | 16 | 10 | 90 | 148 | 60 | 82 | ||||
| Yigit et al.[ | 2013 | 38 | 180 | 30 | 93 | 13 | 9 | 106 | 453 | 56 | 111 | ||||
| Yosioka et al.[ | 2003 | 33 | 100 | 50 | 132 | 15 | 36 | 116 | 332 | 80 | 204 | ||||
| Maeda et al.[ | 2003 | 18 | 37 | 20 | 58 | 13 | 10 | 56 | 132 | 46 | 78 | ||||
| Neugebauer et al.[ | 1998 | 24 | 86 | 31 | 43 | 12 | 17 | 79 | 215 | 55 | 77 | ||||
| Lauszus et al.[ | 2001 | 47 | 542 | 57 | 455 | 8 | 87 | 151 | 1539 | 73 | 629 | ||||
| Ukinc et al.[ | 2009 | 14 | 14 | 11 | 13 | 0 | 0 | 39 | 41 | 11 | 13 | ||||
| Liu et al.# | 2017 | 59 | 42 | 118 | 97 | 85 | 73 | 236 | 183 | 288 | 243 | ||||
"
| Groups | Genetic models | No. of studies (All/Sensitivity) | OR (95%CI) | P | I2(%) | ORse(95%CI) | Pse | I2se(%) |
|---|---|---|---|---|---|---|---|---|
| Overall | Allele (T vs. C) | 28/21 | 1.52 (1.27-1.83) | 0 | 80.2 | 1.46 (1.18-1.82) | 0 | 81.8 |
| Heterozygous (CT vs. CC) | 28/21 | 1.81 (1.40-2.35) | 0 | 73.5 | 1.49 (1.12-1.97) | 0 | 70.1 | |
| Homozygous (TT vs. CC) | 27/20 | 2.27 (1.62-3.18) | 0 | 72.3 | 2.21 (1.41-3.48) | 0 | 78.2 | |
| Dominant model (TT+CT vs. CC) | 28/21 | 1.86 (1.45-2.39) | 0 | 75.0 | 1.65 (1.22-2.24) | 0 | 77.2 | |
| Recessive model (TT vs. CT+CC) | 27/20 | 1.55 (1.16-2.07) | 0 | 73.7 | 1.65 (1.17-2.32) | 0 | 74.5 | |
| Healthy control | Allele (T vs. C) | 14/11 | 1.68 (1.29-2.18) | 0 | 78.4 | 1.84 (1.38-2.46) | 0 | 73.9 |
| Heterozygous (CT vs. CC) | 14/11 | 2.46 (1.64-3.69) | 0 | 77.3 | 2.27 (1.42-3.63) | 0 | 75.8 | |
| Homozygous (TT vs. CC) | 14/11 | 2.55 (1.70-3.83) | 0.008 | 54.4 | 3.02 (1.90-4.80) | 0.036 | 48.3 | |
| Dominant model (TT+CT vs. CC) | 14/11 | 2.31 (1.62-3.29) | 0 | 74.7 | 2.43 (1.53-3.84) | 0 | 78.0 | |
| Recessive model (TT vs. CT+CC) | 14/11 | 1.49 (0.94-2.37) | 0 | 72.3 | 1.87 (1.23-2.83) | 0.042 | 47.1 | |
| Ncd control | Allele (T vs. C) | 5/3 | 1.50 (1.07-2.11) | 0.032 | 62.1 | 1.76 (1.03-3.03) | 0.041 | 68.7 |
| Heterozygous (CT vs. CC) | 5/3 | 1.38 (0.87-2.18) | 0.131 | 43.7 | 1.95 (1.16-3.28) | 0.356 | 3.1 | |
| Homozygous (TT vs. CC) | 5/3 | 2.39 (1.06-5.38) | 0.017 | 66.7 | 2.47 (1.05-5.84) | 0.069 | 62.6 | |
| Dominant model (TT+CT vs. CC) | 5/3 | 1.59 (0.97-2.62) | 0.056 | 56.5 | 2.33 (1.03-5.28) | 0.071 | 62.2 | |
| Recessive model (TT vs. CT+CC) | 5/3 | 1.92 (1.07-3.43) | 0.064 | 55.0 | 1.93 (0.79-4.69) | 0.042 | 47.1 | |
| DM control | Allele (T vs. C) | 9/7 | 1.32 (0.93-1.88) | 0 | 86.6 | 1.17 (0.83-1.66) | 0 | 84.1 |
| Heterozygous (CT vs. CC) | 9/7 | 1.31 (0.87-1.97) | 0.001 | 68.7 | 1.20 (0.79-1.82) | 0.005 | 67.2 | |
| Homozygous (TT vs. CC) | 9/7 | 1.83 (0.91-3.69) | 0 | 85.6 | 1.39 (0.77-2.52) | 0 | 78.0 | |
| Dominant model (TT+CT vs. CC) | 9/7 | 1.42 (0.89-2.28) | 0 | 79.4 | 1.25 (0.80-1.96) | 0 | 75.3 | |
| Recessive model (TT vs. CT+CC) | 9/7 | 1.49 (0.91-2.44) | 0 | 82.3 | 1.22 (0.82-1.83) | 0.002 | 71.6 |
"

"
| Groups | Genetic models | No. of studies (All/Sensitivity) | OR(95%CI) | P | I2(%) | ORse(95%CI) | Pse | I2se(%) | |
|---|---|---|---|---|---|---|---|---|---|
| Healthy control | Asian | Allele (T vs. C) | 9/7 | 1.93 (1.43-2.61) | 0.001 | 69.2 | 2.18 (1.79-2.65) | 0.701 | 0 |
| Heterozygous (CT vs. CC) | 9/7 | 3.22 (2.30-4.51) | 0.163 | 31.9 | 2.80 (2.05-3.83) | 0.630 | 0 | ||
| Homozygous (TT vs. CC) | 9/7 | 3.09 (2.08-4.60) | 0.170 | 31.1 | 3.55 (2.38-5.29) | 0.405 | 2.7 | ||
| Dominant model (TT+CT vs. CC) | 9/7 | 2.90 (2.27-3.70) | 0.598 | 0 | 2.96 (2.22-3.94) | 0.448 | 0 | ||
| Recessive model (TT vs. CT+CC) | 9/7 | 1.68 (0.96-2.95) | 0 | 74.1 | 2.08 (1.47-2.96) | 0.782 | 0 | ||
| Non-Asian | Allele (T vs. C) | 5/4 | 1.32 (0.83-2.09) | 0 | 84.4 | 1.36 (0.72-2.58) | 0 | 88.0 | |
| Heterozygous (CT vs. CC) | 5/4 | 1.53 (0.77-3.06) | 0 | 85.4 | 1.58 (0.58-4.29) | 0 | 89.0 | ||
| Homozygous (TT vs. CC) | 5/4 | 1.60 (0.67-3.83) | 0.015 | 67.8 | 1.80 (0.56-5.83) | 0.014 | 71.9 | ||
| Dominant model (TT+CT vs. CC) | 5/4 | 1.54 (0.78-3.04) | 0 | 85.9 | 1.61 (0.61-4.29) | 0 | 89.5 | ||
| Recessive model (TT vs. CT+CC) | 5/4 | 1.13 (0.43-2.91) | 0.003 | 74.9 | 1.16 (0.31-4.34) | 0.002 | 79.7 | ||
| DM control | Asian | Allele (T vs. C) | 7/5 | 1.49 (0.98-2.26) | 0 | 88.9 | 1.30 (0.89-1.90) | 0 | 85.7 |
| Heterozygous (CT vs. CC) | 7/5 | 1.38 (0.84-2.28) | 0 | 75.9 | 1.25 (0.73-2.14) | 0.001 | 77.5 | ||
| Homozygous (TT vs. CC) | 7/5 | 2.39 (1.05-5.45) | 0 | 88.5 | 1.70 (0.84-3.44) | 0 | 83.4 | ||
| Dominant model (TT+CT vs. CC) | 7/5 | 1.58 (0.90-2.78) | 0 | 83.7 | 1.36 (0.77-2.39) | 0 | 82.5 | ||
| Recessive model (TT vs. CT+CC) | 7/5 | 1.85 (1.03-3.31) | 0 | 85.6 | 1.44 (0.88-2.35) | 0.001 | 77.8 | ||
| Non-Asian | Allele (T vs. C) | 2/2 | 0.91 (0.66-1.26) | 0.455 | 0 | ? | ? | ? | |
| Heterozygous (CT vs. CC) | 2/2 | 1.12 (0.65-1.95) | 0.523 | 0 | ? | ? | ? | ||
| Homozygous (TT vs. CC) | 2/2 | 0.76 (0.36-1.60) | 0.602 | 0 | ? | ? | ? | ||
| Dominant model (TT+CT vs. CC) | 2/2 | 1.03 (0.61-1.75) | 0.45 | 0 | ? | ? | ? | ||
| Recessive model (TT vs. CT+CC) | 2/2 | 0.74 (0.43-1.37) | 0.913 | 0 | ? | ? | ? | ||
| DM control | T2DM | Allele (T vs. C) | 8/7 | 1.37 (0.94-1.98) | 0 | 88.1 | 1.18 (0.87-1.60) | 0 | 80.9 |
| Heterozygous (CT vs. CC) | 8/7 | 1.36 (0.88-2.11) | 0.001 | 72.0 | 1.20 (0.79-1.82) | 0.005 | 67.2 | ||
| Homozygous (TT vs. CC) | 8/7 | 1.83 (0.91-3.69) | 0 | 85.6 | 1.39 (0.77-2.52) | 0 | 78.0 | ||
| Dominant model (TT+CT vs. CC) | 8/7 | 1.49 (0.90-2.47) | 0 | 81.6 | 1.25 (0.80-1.96) | 0 | 75.3 | ||
| Recessive model (TT vs. CT+CC) | 8/7 | 1.49 (0.91-2.44) | 0 | 82.3 | 1.22 (0.82-1.83) | 0.002 | 71.6 | ||
| Healthy control | T2DM | Allele (T vs. C) | 11/9 | 1.81 (1.31-2.49) | 0 | 78.8 | 1.97 (1.43-2.71) | 0 | 72.3 |
| Heterozygous (CT vs. CC) | 11/9 | 2.82 (1.78-4.48) | 0 | 78.5 | 2.67 (1.52-4.70) | 0 | 77.3 | ||
| Homozygous (TT vs. CC) | 11/9 | 2.70 (1.78-4.09) | 0.065 | 42.8 | 2.97 (1.83-4.80) | 0.096 | 40.7 | ||
| Dominant model (TT+CT vs. CC) | 11/9 | 2.75 (1.77-4.27) | 0 | 74.6 | 2.82 (1.63-4.89) | 0 | 79.2 | ||
| Recessive model (TT vs. CT+CC) | 11/9 | 1.48 (0.89-1.51) | 0 | 70.3 | 1.78 (1.25-2.52) | 0.323 | 13.3 | ||
"
| Genetic models | Begg’s adjusted rank correlation test (P value) | Egger’s regression asymmetry test (P value) |
|---|---|---|
| Allele | 0.221 | 0.089 |
| CT vs. CC | 0.048 | 0.031 |
| TT vs. CC | 0.288 | 0.142 |
| Dominant model | 0.048 | 0.056 |
| Recessive model | 0.327 | 0.177 |
| 1. | Duh EJ, Sun JK, Stitt AW . Diabetic retinopathy: current understanding, mechanisms, and treatment strategies. JCI Insight 2017; 2(14):e93751. doi: 10.1172/jci.insight.93751. |
| 2. | Chong YH, Fan Q, Tham YC , et al. Type 2 diabetes genetic variants and risk of diabetic retinopathy. Ophthalmology 2017; 124(3):336-42. doi: 10.1016/j.ophtha.2016.11.016. |
| 3. | Tarr JM, Kaul K, Chopra M , et al. Pathophysiology of diabetic retinopathy. ISRN Ophthalmol 2013; 2013:343560. doi: 10.1155/2013/343560. |
| 4. | Welch GN, Loscalzo J . Homocysteine and atherothrombosis. N Engl J Med 1998; 338(15):1042-50. doi: 10.1056/NEJM199804093381507. |
| 5. | D’Angelo A, Selhub J . Homocysteine and thrombotic disease. Blood 1997; 90(1):1-11. doi: 10.1182/blood.V90.1.1 |
| 6. | Engbersen AM, Franken DG, Boers GH , et al. Thermolabile 5,10-methylenetetrahydrofolate reductase as a cause of mild hyperhomocysteinemia. Am J Human Gene 1995; 56(1):142-50. |
| 7. | Friedman G, Goldschmidt N, Friedlander Y , et al. A common mutation A1298C in human methylenetetrahydrofolate reductase gene: association with plasma total homocysteine and folate concentrations. J Nutr 1999; 129(9):1656-61. doi: 10.1093/jn/129.9.1656. |
| 8. | McCully KS . Homocysteine metabolism, atherosclerosis, and diseases of aging. Compr Physiol 2015; 6(1):471-505. doi: 10.1002/cphy.c150021. |
| 9. | Sen U, Pushpakumar SB, Amin MA , et al. Homocysteine in renovascular complications: hydrogen sulfide is a modulator and plausible anaerobic ATP generator. Nitric Oxide 2014; 41(6):27-37. doi: 10.1016/j.niox.2014.06.006. |
| 10. | Kayadibi H, Sertoglu E, Uyanik M . Plasma total homocysteine levels in diabetic retinopathy. Biomed Res Int 2014; 2014(1):758634. doi: 10.1155/2014/758634. |
| 11. | Liu M, Zhu C, Yan C . Relationship between methylenetetrahydrofolate reductase gene polymorphism and homocysteine in type 1 diabetic microvascular complications. Zhonghua Er Ke Za Zhi 2003; 41(7):555-6. doi: 10.1023/A:1022289509702. |
| 12. | Mrozikiewicz-Rakowska B, Lukawska M, Nehring P , et al. Genetic predictors associated with diabetic retinopathy in patients with diabetic foot. Pol Arch Intern Med 2018; 128(1):35-42. doi: 10.20452/pamw.4144. |
| 13. | Vaccaro O, Perna AF, Mancini FP , et al. Plasma homocysteine and its determinants in diabetic retinopathy. Diabetes Care 2000; 23(7):1026-7. doi: 10.2337/diacare.23.7.1026. |
| 14. | Tawfik A, Markand S, Al-Shabrawey M , et al. Alterations of retinal vasculature in cystathionine-beta-synthase heterozygous mice: a model of mild to moderate hyperhomocysteinemia. Am J Pathol 2014; 184(9):2573-85. doi: 10.1016/j.ajpath.2014.05.018. |
| 15. | Egger M, Zellweger-Zahner T, Schneider M , et al. Language bias in randomised controlled trials published in English and German. Lancet 1997; 350(9074):326-9. doi: 10.1016/S0140-6736(97)02419-7. |
| 16. | Fekih-Mrissa N, Mrad M, Ibrahim H , et al. Methylenetetrahydrofolate reductase (MTHFR) (C677T and A1298C) polymorphisms and vascular complications in patients with type 2 diabetes. Can J Diabetes 2017; 41(4):366-71. doi: 10.1016/j.jcjd.2016.11.007. |
| 17. | Xing G, Xu H, Xu BX , et al. Correlation analysis of methylenetetrahydrofolate reductase (MTHFR) gene polymorphism and diabetic microvascular complications. J Med Forum 2016; ( 11):20-4. |
| 18. | Wei J, Wang LJ, Wang JJ , et al. Association between genetic polymorphisms of serum methyl groups and diabetic complications. South China J Prev Med 2012; 38(2):1-5. |
| 19. | Sun WW . Study on the relationship between methylenetetrahydrofolate reductase gene polymorphism and diabetic microangiopathy [dissertation]. Beijing: Capital Medical School; 2014. |
| 20. | Guo QH, Lu JM, Qin HH , et al. Changes of the plasma homocysteine and its mechanism in type 2 diabetes with microangiopathy. Chin J Diabetes 2002; 10(1):30-4. doi: 10.3321/j.issn:1006-6187.2002.01.009. |
| 21. | Wang LQ, Wang JY, Xue YM , et al. Relationship between methylenetetahydrofolate reductase gene polymorphism and diabetic retinopathy. Chin J Ocul Fundus Dis 2001; 17(3):31-3. doi: 10.3760/j.issn:1005-1015.2001.03.010. |
| 22. | Yang GQ, Lu JM, Pan CY . Study on the relationship between N5, 10-methyleneterahydrofolate reductase gene polymorphism and the susceptibility to microangiopathy in type 2 diabetes mellitus. Chin J Endocrinol Metab 2001; 16(4):36-9. doi: 10.3760/j.issn:1000-6699.2001.04.012. |
| 23. | Sun JZ, Xu YC, Zhu YL , et al. A study of association of polymorphism of methylenetetrahydrofolate reductase gene and diabetic microangiopathy. J Clin Intern Med 2003; 20(12):628-30. doi: 10.3969/j.issn.1001-9057.2003.12.004. |
| 24. | Huang DF, Cao H, Mao L , et al. The relationship of homocysteine, methylenetetrahydrofolate reductase gene polymorphism and diabetic reitinopathy. J Chin Microcirculation 2005; 9(4):229-31. |
| 25. | Yi XX, Yu YG, Zhan YJ , et al. The study on TCM syndrome differentiation of DR and the correlation between its syndroms and types and gene polymorphism. China J Chin Ophthalmol 2005; 15(3):125-8. doi: 10.3969/j.issn.1002-4379.2005.03.001. |
| 26. | Liu DM, Fan XP, Sun Y , et al. Study on the relationship between homocysteine &N5, 10-methylenetrahydrofolate reductase and diabetic retinopathy. Tianjin Med J 2006; 34(1):4-6. doi: 10.3969/j.issn.0253-9896. 2006.01.002. |
| 27. | Ren M . The analysis of risk factors and susceptibility genes of type 2 diabetic retinopathy [dissertation]. Tianjin: Tianjin Medical University; 2011. |
| 28. | Santos KG, Tschiedel B, Schneider J , et al. Diabetic retinopathy in Euro-Brazilian type 2 diabetic patients: relationship with polymorphisms in the aldose reductase, the plasminogen activator inhibitor-1 and the methylenetetrahydrofolate reductase genes. Diabetes Res Clin Pract 2003; 61(2):133-6. doi: 10.1016/S0168-8227(03)00112-8. |
| 29. | Errera FI, Silva ME, Yeh E , et al. Effect of polymorphisms of the MTHFR and APOE genes on susceptibility to diabetes and severity of diabetic retinopathy in Brazilian patients. Braz J Med Biol Res 2006; 39(7):883-8. doi: 10.1590/S0100-879X2006000700005. |
| 30. | Maeda M, Yamamoto I, Fukuda M , et al. MTHFR gene polymorphism is susceptible to diabetic retinopathy but not to diabetic nephropathy in Japanese type 2 diabetic patients. J Diabetes Complications 2008; 22(2):119-25. doi: 10.1016/j.jdiacomp.2006.12.002. |
| 31. | Yigit S, Karakus N, Inanir A . Association of MTHFR gene C677T mutation with diabetic peripheral neuropathy and diabetic retinopathy. MolVis 2013; 19(30):1626-30. |
| 32. | Yoshioka K, Yoshida T, Takakura Y , et al. No association between the MTHFR gene polymorphism and diabetic retinopathy in type 2 diabetic patients without overt nephropathy. Diabetes Care 2003; 26(6):1947-8. doi: 10.2337/diacare.26.6.1947. |
| 33. | Maeda M, Yamamoto I, Fukuda M , et al. MTHFR gene polymorphism as a risk factor for diabetic retinopathy in type 2 diabetic patients without serum creatinine elevation. Diabetes Care 2003; 26(2):547-8. doi: 10.2337/diacare.26.2.547-a. |
| 34. | Neugebauer S, Baba T, Watanabe T . Methylenetetrahydrofolate reductase gene polymorphism as a risk factor for diabetic nephropathy in NIDDM patients. Lancet 1998; 352(9126):454. doi: 10.1016/S0140-6736(05)79188-1. |
| 35. | Lauszus FF, Gron PL, Klebe JG . Association of polymorphism of methylene-tetrahydro-folate-reductase with urinary albumin excretion rate in type 1 diabetes mellitus but not with preeclampsia, retinopathy, and preterm delivery. Acta Obstet Gynecol Scand 2001; 80(9):803-6. doi: 10.1080/j.1600-0412.2001.080009803.x. |
| 36. | Ukinc K, Ersoz HO, Karahan C , et al. Methyltetrahydrofolate reductase C677T gene mutation and hyperhomocysteinemia as a novel risk factor for diabetic nephropathy. Endocrine 2009; 36(2):255-61. doi: 10.1007/s12020-009-9218-7. |
| 37. | Safi SZ, Qvist R, Kumar S , et al. Molecular mechanisms of diabetic retinopathy, general preventive strategies, and novel therapeutic targets. Biomed Res Int 2014; 2014:801269. doi: 10.1155/2014/801269. |
| 38. | Wiltshire EJ, Mohsin F, Chan A , et al. Methylenetetrahydrofolate reductase and methionine synthase reductase gene polymorphisms and protection from microvascular complications in adolescents with type 1 diabetes. Pediatr Diabetes 2008; 9(4 Pt 2):348-53. doi: 10.1111/j.1399-5448.2008.00374.x. |
| 39. | Li YY, Yang XF, Gu H , et al. The Beijing Desheng Diabetic Eye Study: rationale, design, methodology and baseline data. Int J Ophthalmol 2018; 11(1):108-16. doi: 10.18240/ijo.2018.01.19. |
| 40. | Stewart LA, Clarke M, Rovers M , et al. Preferred Reporting Items for Systematic Review and Meta-Analyses of individual participant data: the PRISMA-IPD Statement. JAMA 2015; 313(16):1657-65. doi: 10.1001/jama.2015.3656. |
| 41. | Luo S, Wang F, Shi C , et al. A meta-analysis of association between methylenetetrahydrofolate reductase gene (MTHFR) 677C/T polymorphism and diabetic retinopathy. Int J Environ Res Public Health 2016; 13(8):806-21. doi: 10.3390/ijerph13080806. |
| 42. | Chen D, Wang J, Dan Z , et al. The relationship between methylenetetrahydrofolate reductase C677T polymorphism and diabetic retinopathy: a meta-analysis in multiethnic groups. Ophthalmic Genet 2018; 39(2):200-7. doi: 10.1080/13816810.2017.1401087. |
| [1] | 吴坤荣, 张恕芳, 关紫菀, 李晓黎, 李蕊, 尹影, 李妍. 亚甲基四氢叶酸还原酶基因C677T多态性与中国2型糖尿病患者冠心病风险增加相关[J]. Chinese Medical Sciences Journal, 2021, 36(2): 103-109. |
| [2] | 王站, 王旭, 王文达, 郑国洋, 郭浩, 张玉石. 术前中性粒细胞与淋巴细胞比值预测可切除泌尿系肿瘤预后的价值:系统综述和荟萃分析[J]. Chinese Medical Sciences Journal, 2020, 35(3): 262-271. |
| [3] | 尹影, 李蕊, 李晓黎, 吴坤荣, 李玲, 徐曰东, 廖琳, 杨蕊, 李妍. 伴血脂异常2型糖尿病患者亚甲基四氢叶酸还原酶基因多态性与血浆同型半胱氨酸水平的相关性[J]. Chinese Medical Sciences Journal, 2020, 35(1): 85-91. |
| [4] | 唐惠,朱晓炜,武龙飞,莫兴波,邓飞艳,雷署丰. 整合分析证实骨保护素基因与骨质疏松症的相关性[J]. Chinese Medical Sciences Journal, 2019, 34(2): 147-156. |
| [5] | 黎简平, 傅永平, 常文秀, 易昌容, 刘丽华, 邢海燕. 过氧化物酶体增值物激活受体-γ2基因启动子区C-689T多态性与汉族人群冠心病的相关性[J]. Chinese Medical Sciences Journal, 2017, 32(3): 177-184. |
| 阅读次数 | ||||||
|
全文 |
|
|||||
|
摘要 |
|
|||||
|