Chinese Medical Sciences Journal ›› 2019, Vol. 34 ›› Issue (1): 33-37.doi: 10.24920/003516
• Original Articles • Previous Articles Next Articles
Value of Magnetic Resonance Imaging Texture Analysis in the Differential Diagnosis of Benign and Malignant Breast Tumors
Wang Botao1, Fan Wenping1, Xu Huan1, Li Lihui1, Zhang Xiaohuan1, Wang Kun1, Liu Mengqi1, 3, You Junhao2, *( ), Chen Zhiye1, 3, *()
- 1 Department of Radiology,Department of Oncology, Hainan Hospital of Chinese PLA General Hospital, Sanya, Hainan 572013, China
2 Department of Oncology, Hainan Hospital of Chinese PLA General Hospital, Sanya, Hainan 572013, China
3 Department of Radiology, Chinese PLA General Hospital, Beijing 100853, China
-
Received:2018-09-18Revised:2019-02-22Published:2019-03-30Online:2019-04-08 -
Contact:You Junhao,Chen Zhiye E-mail:24103936@qq.com;yyqf@hotmail.com
Cite this article
Wang Botao, Fan Wenping, Xu Huan, Li Lihui, Zhang Xiaohuan, Wang Kun, Liu Mengqi, You Junhao, Chen Zhiye. Value of Magnetic Resonance Imaging Texture Analysis in the Differential Diagnosis of Benign and Malignant Breast Tumors[J].Chinese Medical Sciences Journal, 2019, 34(1): 33-37.
share this article
Add to citation manager EndNote|Reference Manager|ProCite|BibTeX|RefWorks
Table 1
Comparisons of texture parameters of DWI between the two groups"
| Group | n | ASM [median (QR)] a | Contrast§ | Correlation [median (QR)] a | IDM [median (QR)] a | Entropy§ |
|---|---|---|---|---|---|---|
| Malignant group | 56 | 0.006 (0.010) | 1070.423±511.094 | 0.0003 (0.0000) | 0.034 (0.020) | 5.421±0.912 |
| Benign group | 20 | 0.008 (0.020) | 782.637±424.783 | 0.0004 (0.0000) | 0.046 (0.050) | 4.715±1.028 |
| t/U value | 352.500 | 2.405 | 275.0000 | 473.000 | 2.761 | |
| P value | 0.014 | 0.019 | 0.001 | 0.305 | 0.007 | |
| 95%CI | -0.002-0.017 | 54.132-577.751 | 0.0001-0.0004 | -0.006-0.026 | 0.191-1.179 |
Table 1
Table 2
Receiver operating characteristic curve analysis for the positive texture variables in the Logistic regression model between the breast benign and malignant tumor groups"
| Parameter | AUC | Critical value | 95%CI | Sensitivity | Specificity | Above critical value | Below critical value |
|---|---|---|---|---|---|---|---|
| ASM | 0.685 | 0.0075 | 0.550-0.820 | 0.550 | 0.750 | Benign | Malignant |
| Contrast | 0.681 | 908.7935 | 0.543-0.820 | 0.700 | 0.625 | Malignant | Benign |
| Correlation | 0.754 | 0.0004 | 0.628-0.881 | 0.600 | 0.821 | Benign | Malignant |
| Entropy | 0.683 | 4.9345 | 0.547-0.818 | 0.550 | 0.732 | Malignant | Benign |
Table 2
Table 3
Binary Logistic regression coefficients, standard error and P value of texture parameters"
| Independent variable | Regression coefficient | Standard error | Wald χ2 | P value |
|---|---|---|---|---|
| ASM | 58.453 | 31.984 | 3.340 | 0.068 |
| Contrast | 0.003 | 0.001 | 10.181 | 0.001 |
| Entropy | 1.980 | 0.664 | 8.882 | 0.003 |
| Constant | -12.137 | 4.071 | 8.870 | 0.003 |
Table 3

Figure 1.
ROC curve of texture parameters of logistic regression model for breast benign and malignant tumors."
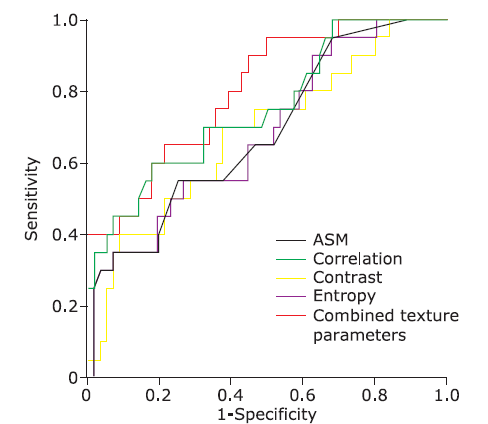
Figure 1.
| 1. |
Chen W, Zheng R, Zhang S , et al. Cancer incidence and mortality in China in 2013: an analysis based on urbanization level. Chin J Cancer Res 2017; 29(1):1-10. doi: 10.21147/j.issn.1000-9604.2017.01.01.
doi: 10.21147/j.issn.1000-9604.2017.01.01 |
| 2. |
Cho N, Han W, Han BK , et al. Breast cancer screening with mammography plus ultrasonography or magnetic resonance imaging in women 50 years or younger at diagnosis and treated with breast conservation therapy. JAMA Oncol 2017; 3(11):1495-502. doi: 10.1001/jamaoncol.2017.1256.
doi: 10.1001/jamaoncol.2017.1256 pmid: 28655029 |
| 3. |
Chen Z, Feng F, Yang Y , et al. MR imaging findings of the corpus callosum region in the differentiation between multiple sclerosis and neuromyelitis optica. Eur J Radiol 2012; 81(11):3491-5. doi: 10.1016/j.ejrad.2012.02.010.
doi: 10.1016/j.ejrad.2012.02.010 pmid: 22445592 |
| 4. |
Wang B, Liu G, Fan W , et al. Value of texture feature analysis in the differential diagnosis of hepatic cyst and hemangioma in magnetic resonance imaging. Zhongguo Yi Xue Ke Xue Yuan Xue Bao 2017; 39(2):169-76. doi: 10.3881/j.issn.1000-503X.2017.02.002.
doi: 10.3881/j.issn.1000-503X.2017.02.002 pmid: 28483013 |
| 5. | Bo H, Ma FL, Jiao LC . Research on computation of GLCM of image texture. Dianzi Xue Bao 2006; 34(1):57-60. doi: 10.3321/j.issn:0372-2112.2006.01.032. |
| 6. | Mohanaiah P, Sathyanarayana P, Gurukumar L . Image texture feature extraction using GLCM approach. Inter J Sci Res Publications 2014; 3(5):1-5. |
| 7. |
Polyak K . Heterogeneity in breast cancer. J Clin Invest 2011; 121(10):3786-8. doi: 10.1172/JCI60534.
doi: 10.1172/JCI60534 |
| 8. |
Alvarenga AV, Pereira WC, Infantosi AF , et al. Complexity curve and grey level co-occurrence matrix in the texture evaluation of breast tumor on ultrasound images. Med Phys 2007; 34(2):379-87. doi: 10.1118/1.2401039.
doi: 10.1118/1.2401039 pmid: 17388154 |
| 9. |
Huber S, Danes J, Zuna I , et al. Relevance of sonographic B-mode criteria and computer-aided ultrasonic tissue characterization in differential/diagnosis of solid breast masses. Ultrasound Med Biol 2000; 26(8):1243-52.
doi: 10.1016/S0301-5629(00)00274-X pmid: 11120360 |
| 10. |
Lefebvre F, Meunier M, Thibault F , et al. Computerized ultrasound B-scan characterization of breast nodules. Ultrasound Med Biol 2000; 26(9):1421-8.
doi: 10.1016/S0301-5629(00)00302-1 pmid: 11179616 |
| 11. |
Sivaramakrishna R, Powell KA, Lieber ML , et al. Texture analysis of lesions in breast ultrasound images. Comput Med Imaging Graph 2002; 26(5):303-7.
doi: 10.1016/S0895-6111(02)00027-7 pmid: 12204234 |
| 12. |
Chen Z, Chen X, Liu M , et al. Texture features of periaqueductal gray in the patients with medication-overuse headache. J Headache Pain 2017; 18(1):14. doi: 10.1186/s10194-017-0727-0.
doi: 10.1186/s10194-017-0727-0 pmid: 28155029 |
| 13. |
Chen Z, Chen X, Liu M , et al. Magnetic resonance image texture analysis of the periaqueductal gray matter in episodic migraine patients without T2-visible lesions. Korean J Radiol 2018; 19(1):85. doi: 10.3348/kjr.2018.19.1.85.
doi: 10.3348/kjr.2018.19.1.85 |
| 14. |
Xia J, Broadhurst DI, Wilson M , et al. Translational biomarker discovery in clinical metabolomics: an introductory tutorial. Metabolomics 2013; 9(2):280-99. doi: 10.1007/s11306-012-0482-9.
doi: 10.1007/s11306-012-0482-9 |
| Viewed | ||||||
|
Full text |
|
|||||
|
Abstract |
|
|||||
|